Moving Average » Complete Guide for Trading
The moving average is one of the most versatile and widely used technical indicators in the stock market. Due to the way it is constructed and the fact that it can be easily quantified and tested, it is the basis of many trend following systems. Graphical analysis, or chartism, tends to be subjective and difficult to test. Trading rules based on moving averages, on the other hand, are simple and indisputable. While two technicians can disagree on the nature of a price pattern, such as between a triangle and a wedge, the signals from moving averages are precise and not open to discussion.
In this article, discover what moving averages are, what they are used for, what the different types of moving averages are, as well as concrete examples on how to use them properly to trade on the stock market.
What is a moving average? What are the different types of moving averages?
The moving average is the most popular indicator to trade in for technical analysis, and for good reason, it's both simple to use and effective.
Moving average: definition
Let's start by defining what a moving average is. As the name suggests, it is an average of a number of data. For example, if one wishes to obtain an average of the closing prices over 10 days, one adds the prices of the last 10 days and one divides the total by 10. The term “moving” is used insofar as only the prices of the Last 10 days are used in the calculation. Therefore, the set of data to be averaged (the last 10 closing prices) advances day by day.
Moving average: what objectives?
Moving averages are basically a trend following tool. Their purpose is to identify or signal that a new trend has started or a previous trend has ended (range phase) or reversed. Its purpose is to follow the evolution of the trend. A moving average can be thought of as a curvilinear trend line. On the other hand, it does not make it possible to predict the behavior of the market as chartism attempts to do. Moving averages are used to follow a trend, not to predict it. They never anticipate, they only react. They therefore allow us to indicate changes in trend after the fact.
The chart representation of the moving average lags the market action. A short moving average, such as a 20-day average, is by definition closer to price than a 200-day average. Lag is reduced with shorter averages, but can never be completely eliminated. Short-term averages are more sensitive to price action, while long-term averages are less so. In some types of markets, it is therefore more advantageous to use a shorter average and, in other cases, a longer average, which will be less sensitive as a result.
Simple moving average
The simple moving average, or arithmetic mean, is the most widely used on the markets. But some question its usefulness on two points. The first point is that only the period covered by the average (the last 10 days, for example) is taken into account. The second point is that the simple moving average gives the same weight during each day. For a 10-day average, the last day has the same weight as the first day. Each day's price is weighted by 10%. In a 5-day average, each day would have a weighting equal to 20%. Some analysts believe that a greater weighting should be given to recent price actions. On the chart below, the last point of the simple moving average at 6,784 points is calculated in relation to the last ten candles present in the rectangle.
Example of simple moving average CAC 40 August 2021
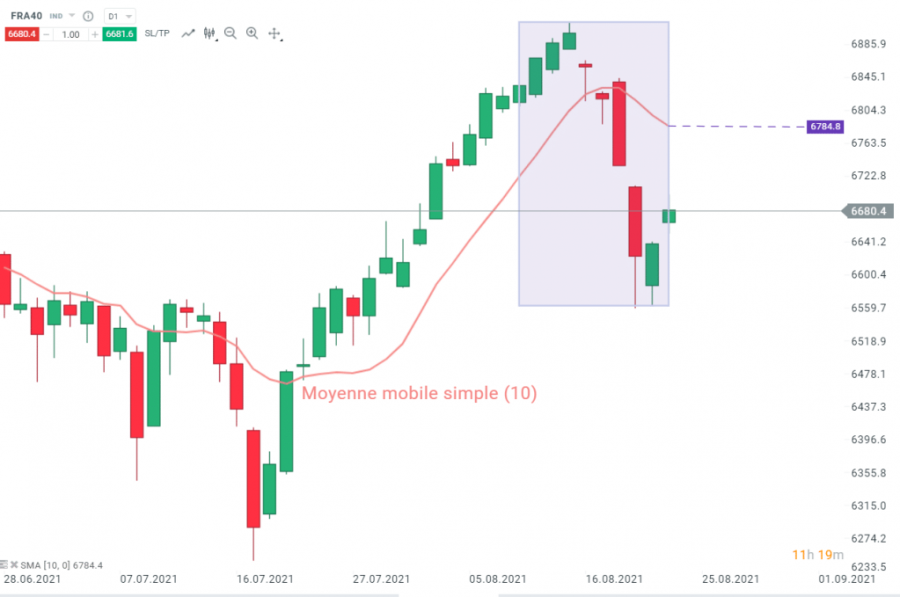
The above chart is a Graphical representation of the CAC 40 (FRA40) in daily data with a 10-day simple moving average.
Linear Weighted Moving Average
In an attempt to correct the weighting problem, some analysts use the linearly weighted moving average. In this case, the closing price on the 10th day (for a 10-day average) is multiplied by 10, on the ninth day by nine, on the eighth day by eight, and so on. Greater weight is therefore given to the most recent fences. The total is then divided by the sum of the multipliers (55 in the case of the 10-day average: 10 + 9 + 8 + 7 …+ 1).
Exponential Moving Average
The exponential moving average solves both problems associated with the simple moving average. First, the exponential moving average assigns greater weight to more recent data. It is therefore a weighted moving average. Even if it gives less importance to old data, it includes in its calculation other closing prices according to the chosen duration. This moving average applies weighting factors that decrease exponentially. With each new period, the weighting decreases by a factor or percentage compared to that of the previous period. The exponential moving average is therefore more reactive than the simple moving average, since each value is weighted, but this weighting decreases exponentially towards the past.
How to invest and trade with moving averages?
Identify trend signals with short-term and long-term averages
The simple moving average is the most used by technical analysts. Some traders use a single moving average to generate trend signals. When the closing price crosses above the moving average, a buy signal is generated. A sell signal is given when prices cross below the moving average. For further confirmation, some are waiting for the moving average to follow the price decline.
By using a very short-term average (5 or 10 days), the average tracks prices very closely and several crossovers occur. Using a very sensitive average therefore produces more signals, including many false signals. If the average is too sensitive, some of the short-term random price movement (or “noise”) generates false trend signals.
Although the shorter average generates more false signals, it has the advantage of giving trend signals earlier in the move. It goes without saying that the more sensitive the average, the earlier the signal will be. The trick is to find the average that is sensitive enough to generate early signals, but insensitive enough to avoid most of the “noise”.
Let's explore the reasoning above. While the longer average performs better when the current trend continues, it loses effectiveness when the trend reverses. The insensitivity of the longer average (the fact that it follows the trend further), which prevented it from generating false signals during short-term corrections, works against it when the trend reverses . Therefore, it should be noted that longer averages work best as long as the trend remains strong, but a shorter average is better when the trend is reversing. It therefore seems obvious that the use of a single moving average has several disadvantages. It is generally more sensible to use two moving averages.
Identifying trend signals with the double crossing of moving averages
The double crossover method provides a buy signal when the shorter average crosses the longer average. For example, two common combinations for short-term strategies are 5 and 20 day averages and 10 and 50 day averages. In the first case, a buy signal occurs when the 5-day average crosses below the 20-day average. In the second example, the crossing of the 10-day average above the 50-day average signals an uptrend, and a downtrend could unfold when the 10-day average crosses below the 50-day average.
As can be seen in the chart below, the crossing of the 10-day moving average with the 50-day moving average made it possible to take advantage of a good part of the decline that began at the end of February 2020. However , this system provides many false signals in the opposite direction to the underlying trend as we will see later on the CAC 40 .
Examples of double crossing of 10- and 50-day moving averages on the CAC 40 in 2020

The above chart is CAC 40 (FRA40) in daily data with moving averages 10 and 50.
Taking into account the crossing of two moving averages produces signals with a more pronounced delay than when using a single average. On the other hand, there will be fewer false signals. On stock market indices, the use of the crossing of the 50-day moving average and the 200-day moving average is very common. Since this system is widely used by responders, these crossovers are considered very reliable signals.
Identifying trend signals with the triple crossing of moving averages
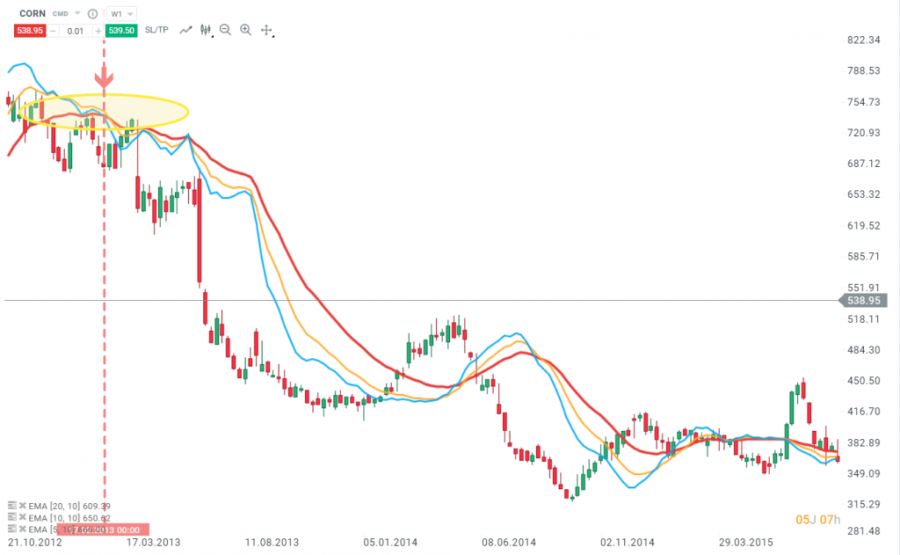
We will now focus on the method of triple crossing. The most widely used triple crossover system is the popular combination of 4-9-18 day moving averages. The 4-9-18 day method is mainly used for futures trading . This system is a variation of the 5, 10 and 20 day moving averages in the commodity markets .
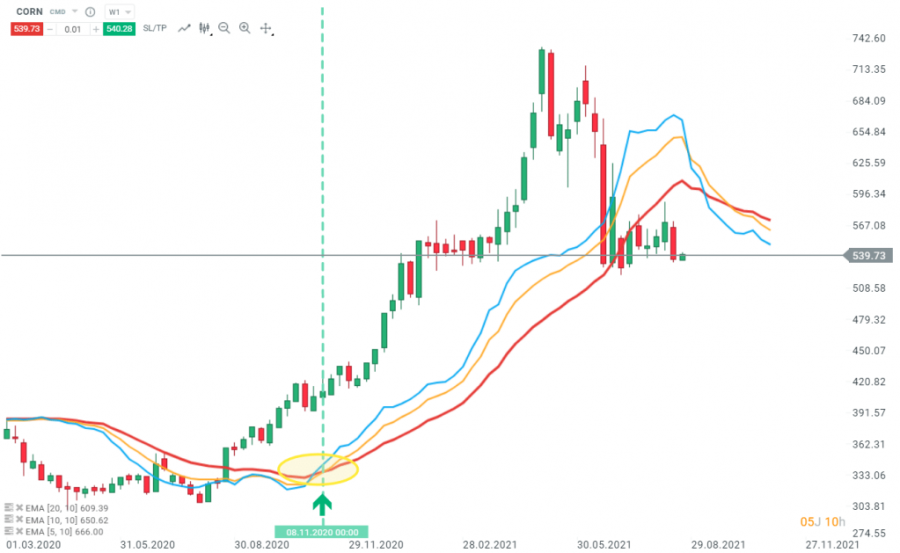
Exponential moving averages are used as a crossover system, using three different exponential moving averages (short, medium and long term).
Example of a sell signal with the crossing of the 5, 10 exponential moving averages with the 20-period corn average
Example of a buy signal with the crossing of the 5, 10 exponential moving averages with the 20-period corn average
How to choose a period for a moving average?
Moving averages work best on a daily chart and in a market with a clear trend . (If the trend is not stable, then moving averages give a lot of false signals.) It is also worth noting that moving averages are applicable not only to price movement, but also to other technical indicators. For example, the 5-day moving average is often used to track changes in trading volume.
The slope of the moving average shows the direction of the mood of market participants. A rising MA indicates growing optimism (bullish), while a falling MA indicates growing pessimism (bearish).
When working with moving averages, there is a simple rule: the longer the trend needs to be determined, the longer the period of the moving average should be. And vice versa, the shorter the trading period, the shorter the indicator setting period should be.
So, for example, for day trading it is best to choose the 10-day Moving Average (MA 10), and for the medium-term - 20-day and 50-day (MA 20 and MA 50). In turn, the 200-day MA is more suitable for evaluating investments for the long term.
Moving Average Trading Strategy
A moving average can perform the same function as a trend line, i.e. serve as a support line when prices fall in an uptrend and resistance when prices rise in a downtrend.
Therefore, with an upward movement of the Moving Average, it is better to play for an increase, and for a downward movement, it is better to play for a fall. A breakout of the moving average can be viewed as a breakout of the trendline and a signal for a change in trend.
- With a rising MA, buy when prices fall to or slightly below the MA. Go long and place a protective stop below the recent low.
- With a descending MA, enter a short (sell) position when prices jump to the MA or slightly higher. Place a protective stop order just above the recent high and move it to break even when the price falls below the MA.
- With a flat (horizontal) movement of the MA with minor fluctuations, do not open positions. Trading in the market without the idea of movement carries an unjustified risk.
The advantage of a moving average over a trend line is that it allows you to combine several (usually no more than two) curves to obtain additional trading signals.
Therefore, along with the crossing of the moving average price, you can use the intersection of short-term (fast), for example, MA 20, and medium-term moving averages (slow) - for example, MA 50. This approach gives more reliable signals. Following this strategy:
- Buy when the fast moving average crosses above the slow moving average.
- Sell when the fast moving average crosses below the slow moving average.
An additional signal when working with the MA indicator is the difference between two moving averages. So, during a strong uptrend, the short-term average rises faster than the long-term one.
The distance between the two moving averages increases. A shrinking distance is usually an early signal that an uptrend is losing momentum.
What are the limits of moving averages?
There are 2 major limitations of moving average technical indicator:
- A sometimes complex choice of period
- The possible presence of false signals
Let us discuss them in detail:
A sometimes complex choice of period
As we have seen, the difficulty that a trader may encounter when using moving averages lies first of all in the choice of periods. Indeed, each instrument will react more or less well to different moving averages. It is therefore necessary to adapt the parameters of the moving averages (simple or exponential) and the number of periods (5, 10, 20, 50, 100, 200) to each instrument, over a given time unit (5 minutes, 15 minutes , 1 hour, 4 hours, 1 day, 1 week, 1 month).
The possible presence of false signals
Furthermore, the large number of false signals for short moving averages, or the delay that long moving averages will have, requires the application of other tools, such as oscillators, which can act as filters and provide indications concerning the strength of the trend. In this sense, many traders will use the RSI or also the MACD .
For example, a downward crossing of the 50-period moving average with that of 200 periods, commonly called a “death cross”, will only occur after an initial bearish phase. However, due to this lag, this crossing of moving averages can be used as a confirmation of a trend reversal or as a signal in combination with other oscillators or ideally, in the presence of a signal from chartist analysis. classic.
Below is an example of the use of moving averages on Bitcoin , in addition to chartism. A first sell signal was given when prices broke out of the upward slant connecting the troughs (red circle). There followed a “death cross”, a sell signal showing a certain delay. However, only a break of the major support at $30,000 would have confirmed the signal generated by the crossing of the moving averages. A buy signal was generated at the breakout of the bearish slant linking the recent highs. A break of the psychological threshold at $50,000 would strengthen the bullish outlook. Such prospects could be confirmed very soon if we witness a “golden cross”.
Example of a chartist analysis combined with the 50 and 200 moving averages on Bitcoin
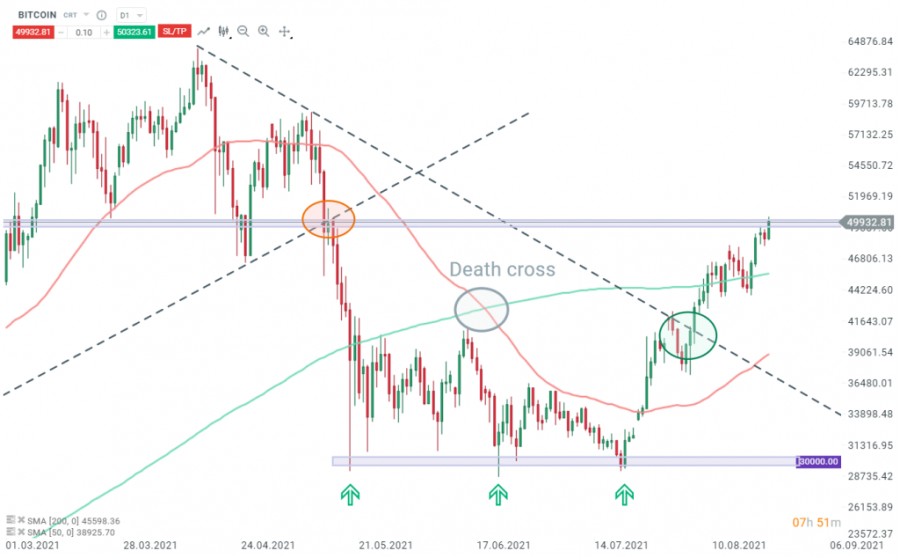
It seems pretty clear that using the crossover of a short moving average with a long moving average is too far behind to take full advantage of a downside correction during a long-term uptrend. On the other hand, as we will see later, this tool can be very useful in order to confirm a recovery in the direction of the underlying trend.
Practical cases of using moving averages on the CAC 40 index
We will now look at the CAC 40 index and apply different strategies to it on moving averages.
Example of a 50 moving average and 100 moving average crossover strategy on the CAC 40 in 2020
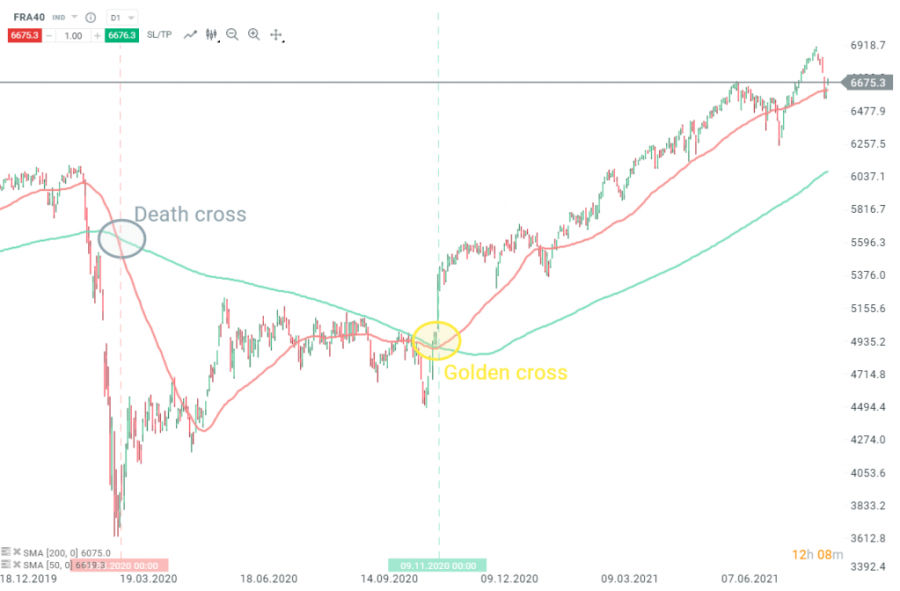
The crossover strategy (in gray on the graph) of a short moving average (50 days) with a long moving average (200 days) will not have made it possible to detect the considerable decline caused by the spread of COVID19. Indeed, the “death cross” generated a very delayed signal, when the decline had ended. On the other hand, the “golden cross” (in yellow on the graph) will have made it possible to confirm the recovery in the direction of the underlying trend. Thus, this system seems more suitable in trend following strategies.
Example of a 5 moving average and 20 moving average crossover strategy on the CAC 40 in 2021
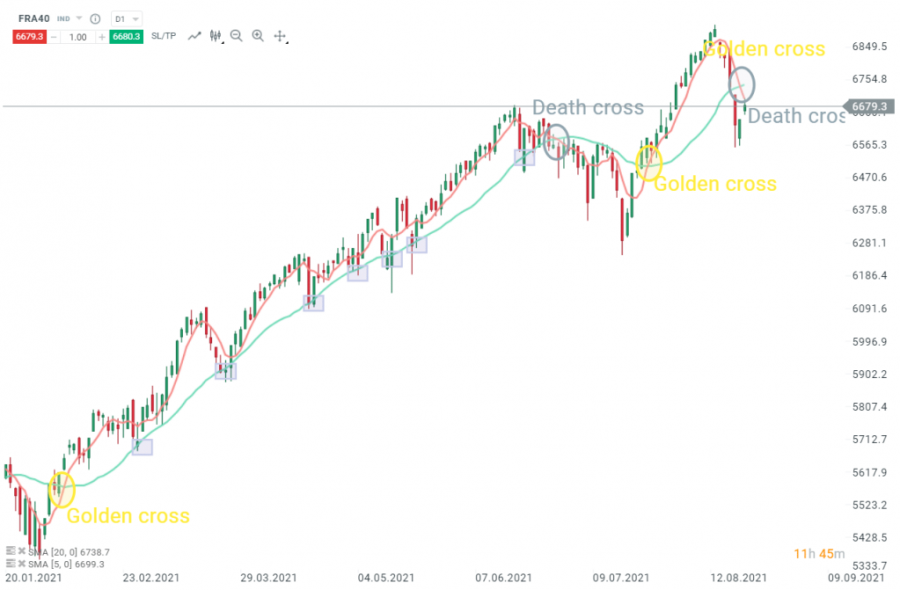
We are now going to use the 5 and 20 moving averages, in order to apply the moving averages to a more aggressive trading strategy, resulting in more signals.
Since the moving averages are shorter, the lag effect is much less present. The first “golden cross” (in yellow on the graph) made it possible to take full advantage of a rise of nearly 19.5% supported by the 5-day moving average acting as support (blue rectangles). The “death cross” (in gray on the graph) which occurred subsequently made it possible to anticipate a drop of more than 5%. The last “death cross” will have made it possible to benefit from an increase of more than 6%.
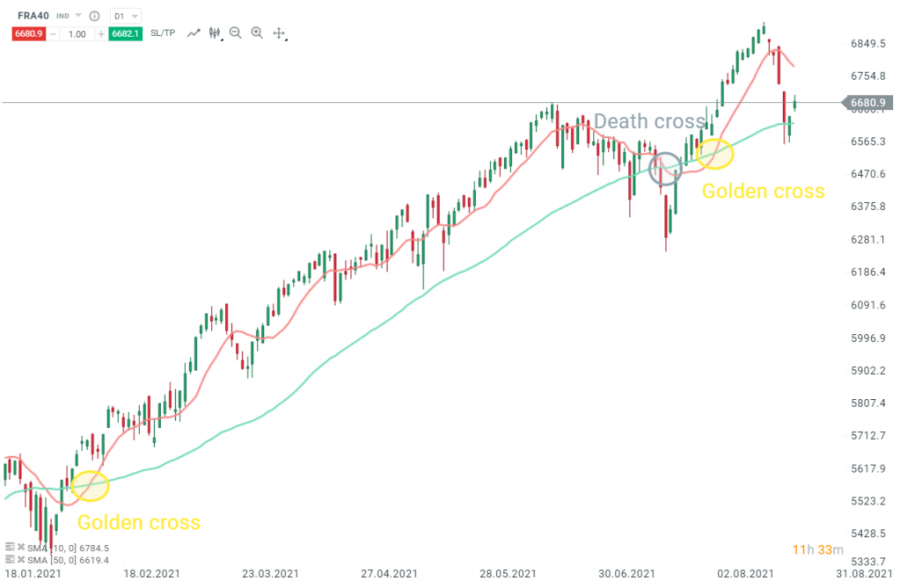
It should be noted that using the 20 and 50 day moving averages also provides very good results in predicting a recovery in the direction of the underlying trend. On the other hand, signals in the opposite direction to the underlying trend will generally be too delayed, as can be seen in the chart below (“death cross” too late).
Example of a 10 moving average and 50 moving average crossover strategy on the CAC 40 in 2021
Conclusion
To conclude, moving averages are very easy to use and will suit both beginners and experienced traders. However, their configuration requires a test phase, and the system used must be adapted to each instrument.
Moving averages are a very useful tool in any unit of time, and if combined with other methods they can be very useful. This very versatile tool can also be of great help with regard to money management . Indeed, a moving average can be used as take profit or stop-loss.