MACD Technical Indicator Complete Tutorial
This article discusses MACD technical indicator, calculation of MACD, how to read MACD, advantages of the MACD, disadvantages of MACD.
Introduction to MACD
The MACD trend oscillator, or Moving Average Convergence/ Divergence indicator, is one of the most common classic technical analysis tools.
This indicator was developed by the famous New York trader Gerald Appel in 1979 to analyze the stock market, and then migrated to other markets, in particular the futures and currency markets. Gerald Appel is also the author of a number of books such as “Winning Marker System: 83 ways to beat the market”, “Stock market trading systems” “New directions in technical analysis” and others, and also published his own newsletter “Systems and Forecasts”.
The MACD indicator is a so-called trend oscillator that combines the properties of both a trend indicator and an oscillator. MACD is calculated based on moving averages. The purpose of the indicator is to simplify the visual perception of the signals given by moving averages, reduce the delay and remove a number of shortcomings inherent in conventional trend indicators. There are two ways to plot: MACD Linear and MACD Histogram.
The MACD can be useful for measuring market momentum and possible price trends and is used by many traders to identify potential entry and exit points.
Before diving into how the MACD works, it is important to understand the concept of moving averages . Moving averages (MA) are simply a line that represents the average of previous data over a given period. In relation to financial markets, moving averages are one of the most popular indicators for technical analysis (TA), and they can be divided into two different types: simple moving averages (SMA) and exponential moving averages (EMA). While SMAs weight all inputs equally, EMAs place more weight on the most recent data (newer price points).
How MACD works
The MACD indicator is generated by subtracting two exponential moving averages (EMAs) to create a main line (MACD line), which is then used to calculate another EMA representing the signal line.
In addition, there is a MACD histogram which is calculated based on the differences between these two lines. The histogram, along with the other two lines, fluctuates above and below the center line, also called the zero line.
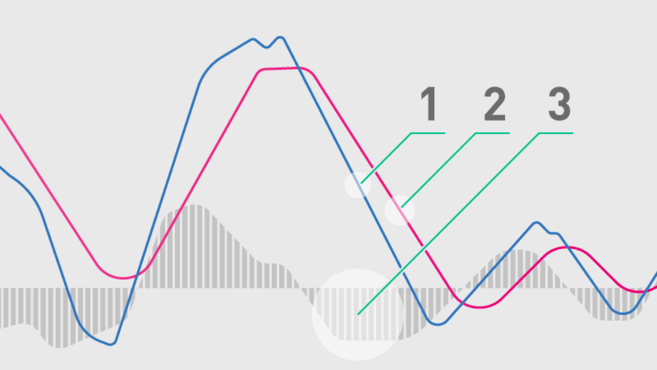
Therefore, the MACD indicator consists of three elements moving around the zero line:
- MACD Line (1): Helps identify upward or downward momentum (market trend). It is calculated by subtracting two exponential moving averages.
- MACD Signal line (2): EMA of the MACD line (usually a 9-period EMA). Combined analysis of the signal line with the MACD line can be useful for identifying potential reversals or entry and exit points.
- Histogram (3): A graphical representation of the divergence and convergence of the MACD line and the signal line. In other words, the histogram is calculated based on the differences between the two lines.
MACD Line
In general, exponential moving averages are measured according to the asset's closing prices, and the periods used to calculate the two EMAs are usually set to either 12 periods (faster) or 26 periods (slower). The period can be configured in different ways (minutes, hours, days, weeks, months), but this article will focus on daily settings. However, the MACD indicator can be customized to suit different trading strategies.
Assuming standard time frames, the MACD line itself is calculated by subtracting the 26-day EMA from the 12-day EMA.
MACD line = 12d EMA - 26d EMA
As mentioned, the MACD line fluctuates above and below the zero line and this is what signals a center line crossover, telling traders when the 12-day and 26-day EMAs change their relative position.
MACD Signal Line
By default, the signal line is calculated from the 9-day EMA of the main line and, as such, provides additional information about its previous moves.
Signal line = 9d EMA of MACD line
And although they are not always accurate when the MACD line and the signal line cross, these events are usually seen as trend reversal signals, especially when they occur at the ends of the MACD chart (much higher or much lower than the zero line).
MACD Histogram
A histogram is nothing more than a visual record of the relative movements of the MACD line and the signal line. It is simply calculated by subtracting one from the other:
MACD histogram =MACD line - signal line
However, instead of adding a third moving line, the histogram consists of bars on the chart, making it visually easy to read and interpret. Please note that the bars of the histogram have nothing to do with the trading volume of an asset.
MACD Settings
As discussed earlier, the default settings for MACD are based on EMAs with 12, 26 and 9 day periods, hence MACD (12,26,9). However, some technical analysts change the periods to create a more sensitive indicator. For example, MACD (5,35,5) is one that is often used in traditional financial markets along with longer timeframes such as weekly or monthly charts.
It is worth noting that due to the high volatility of the cryptocurrency markets, increasing the sensitivity of the MACD indicator can be risky because it can lead to more false signals and misleading information.
Terminology used in MACD
Over the years, elements of the MACD have become known by multiple and often over-loaded terms. The common definitions of particularly overloaded terms are:
Divergence
- As the D in MACD, “divergence” refers to the two underlying moving averages drifting apart, while “convergence” refers to the two underlying moving averages coming towards each other.
- Gerald Appel referred to a “divergence” as the situation where the MACD line does not conform to the price movement, e.g. a price low is not accompanied by a low of the MACD.
- Thomas Asprey dubbed the difference between the MACD and its signal line the “divergence” series.
In practice, definition number 2 above is often preferred.
Histogram
- Gerald Appel referred to bar graph plots of the basic MACD time series as “histogram”. In Appel's Histogram the height of the bar corresponds to the MACD value for a particular point in time.
- The difference between the MACD and its Signal line is often plotted as a bar chart and called a “histogram”.
In practice, definition number 2 above is often preferred.
How to read MACD
We are at the most important point of this article. Let's see what signals the MACD indicator gives.
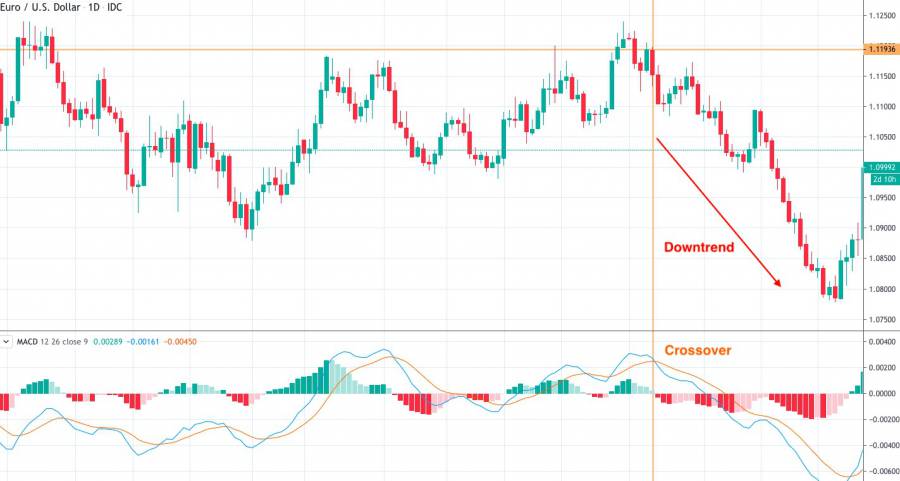
1.Crossover
The first and the most common function of the indicator is the buy/sell signal. A buy signal appears when the MACD line breaks above the signal line. A sell signal occurs when the MACD crosses the signal line in reverse. The signal will be more influential within the strong trend. In the case of a weak trend, the signal may turn out to be false as the market changes.
2. Overbought/Oversold Zone
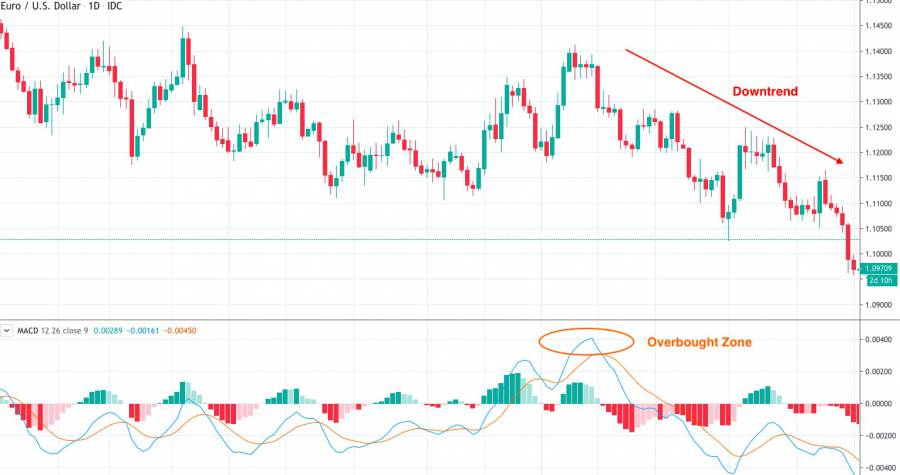
Do not forget that the MACD is an oscillator, so one of its functions is to determine market conditions. Both lines will be the crucial point that you need to consider. If they form significant tops or bottoms, it is a sign of an upcoming correction. It is not necessary to mention any specific level. You will understand when the rise, or fall, is more significant than usual.
If the lines reach the top, it shows that the asset is overbought. Wait for the downside reversal. If they form a low extreme, expect a reversal to the upside. In this case, you can combine the MACD with the RSI for additional confirmation.
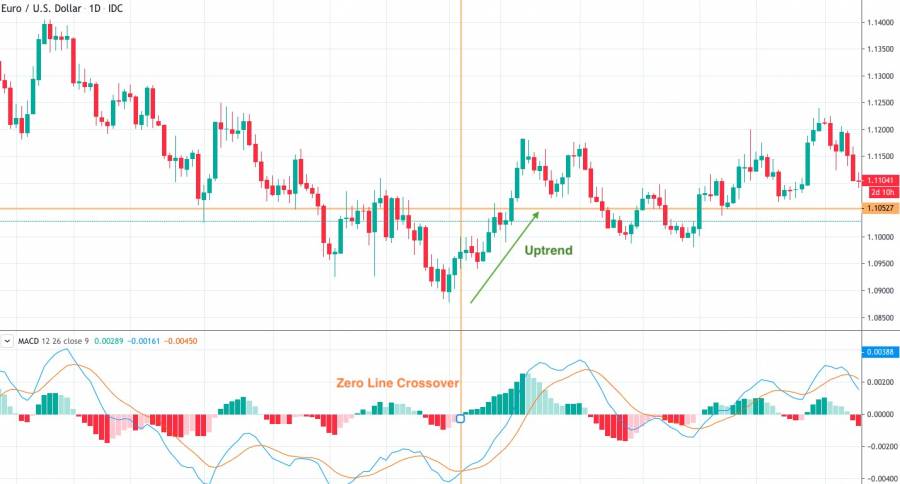
3. Zero Line Crossover
Pay attention to the MACD histogram. If it rises above the 0 level, it is a sign of the uptrend. If it falls below the 0 line, consider opening a short position. However, be careful. The signal works in a strong trend. In times of high volatility, the histogram can move up and down frequently, and that will generate false signals.
4. Convergence/Divergence
A MACD convergence/divergence is a difference between the direction of the price and the indicator. Bullish convergence occurs when price forms lower lows while the MACD histogram makes higher lows. It is a buy signal. Bearish divergence forms when the price sets new highs while the extremes of the MACD indicator turn lower. It is a sell signal.
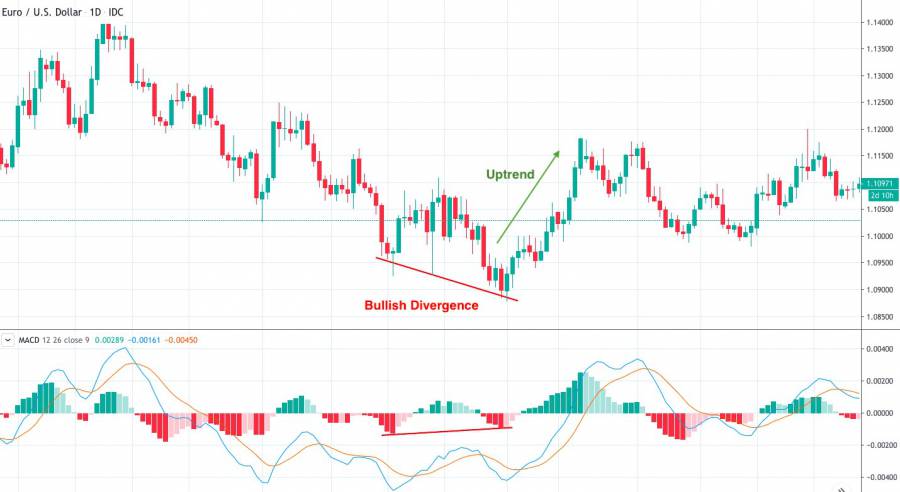
MACD-histogram chart
The MACD histogram measures the distance between the MACD line and the signal line. She plots this difference as a histogram - a series of vertical bars.
If MACD is above the signal line, then the value of the MACD-histogram is positive and is plotted upwards from the horizontal axis (zero). If the MACD is below the slow one, then the MACD-Histogram has a negative value and is plotted below the horizontal axis. When the MACD and the signal line cross, the MACD-Histogram is 0. When the gap between the MACD line and the signal line increases, the MACD-Histogram becomes wider. As the two lines converge, the MACD-Histogram becomes narrower.
MACD-Histogram Signals
Some authors, in particular A. Elder (Book how to play and win on the stock exchange), believe that the MACD histogram gives a deeper understanding of the balance of power between bulls and bears than the original MACD. Using the MACD-histogram makes it possible to assess not only who is stronger at the moment, buyers or sellers, but also the trend of their strength, how and at what speed the advantage between them changes.
- The slope of the MACD histogram does not indicate the current preponderance of sellers and buyers, but how the balance of power is changing: an upward slope indicates that buyers are becoming even stronger than before (but not necessarily stronger than sellers), and a downward slope indicates that sellers are becoming stronger (but not necessarily stronger than the buyers), so the change in slope is a signal of the MACD histogram . A change in the downward slope from “down” to “up” gives a signal to buy. A change in slope from “up” to “down” gives a sell signal.
- If there is a growing trend in the market, and the slope of the MACD histogram is down, this means that the trend growth rate is gradually decreasing and you need to start looking for points to sell. On the contrary, if there is a downtrend in the forex market, and theMACD histogram is growing, this means that the rate of price decline is decreasing and you need to gradually think about closing positions to sell or think about buying.
- In most cases, MACD highs and lows - histograms anticipate the highs and lows of the price for a very long time, so when such highs and lows appear on the MACD indicator chart , you should prepare for appropriate actions. But it is to prepare, and not to make purchases and sales. For example, when the MACD histogram reaches its maximum values during a rise in prices, then the uptrend is at its highest development and the next high on the price chart is likely to be larger than the previous one. Accordingly, if the MACD -histogram falls to a new low during a downtrend, then most likely the new price low will be lower than the previous one.
- Divergences (Bullish Divergence and Bearish Convergence) allow you to catch the moments of major reversals and the beginning of a new trend.
Histogram signal line crossing
The intersection of two moving averages is the moment when the histogram crosses the zero mark, when a signal is formed for the beginning of a new trend. If the difference between the two moving averages increases and, accordingly, the values ??of the histogram grow, we can talk about the strength of the current trend. The option to enter the market here is the moment when the signal line crosses the border of the histogram area. If the signal line leaves the histogram area above zero, then this is a sell signal. If the signal line leaves the histogram area below zero, this is a buy signal.
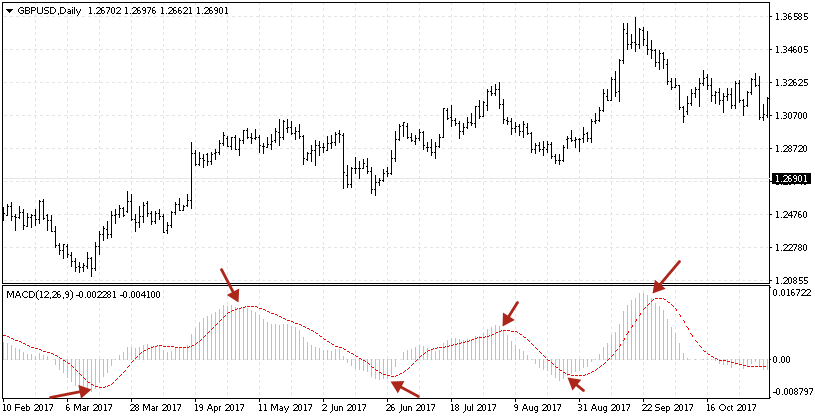
Remember the rules in MACD Interpretation
A divergence is when the price makes a higher high or a higher low while the indicator makes a lower high or lower low in the meantime.convergence is when price makes a lower high or lower low while the indicator makes a higher high or higher low in the meantime
.
MACD Strategy: Follow the Trend
This is how you can use the MACD in trading:
- The first step is to wait for the MACD to swing higher. It is essential that the price forms the swing higher as well. After that, we should look for a lower swing. Once again, the swing low of the indicator should be confirmed by the swing low of the price.
- After getting two highs of both price and indicator, we need to connect them with a trend line.
- The third step is to wait for the MACD breakout. The MACD line crossing the signal line from bottom to top is not enough. The indicator should break above the trend line we drew. It will be the entry point. Open a long position as soon as the MACD crosses the trend line from bottom to top.
- Remember about the stop-loss order. You should place the stop loss 5-10 pips below the last price swing low.
- Now, you must wait for a good exit point. Close the position as soon as the MACD crosses the signal line in the opposite direction of the entry point. It means from top to bottom. However, do not immediately close the trade as soon as you notice the MACD crossover. Wait for a candle to close to make sure the crossover has occurred. Then you can close your position.
You can use the same rules, but in reverse, to open a short position.

Bollinger Bands and MACD indicator
To use divergences more effectively, traders add a second indicator to the chart in order to receive additional signals on it. For example, very often such an indicator is Bollinger Bands . The indicator bars show the actual boundaries for the maximum and minimum prices, the quotes going beyond which is considered a strong price deviation. If a divergence is formed when the price goes beyond the bands, this serves as a strong signal to open a position. The return of the price chart to the boundaries of the Bollinger Bands will confirm that the momentum has ended and prices are trying to move within the framework of working out the divergence.
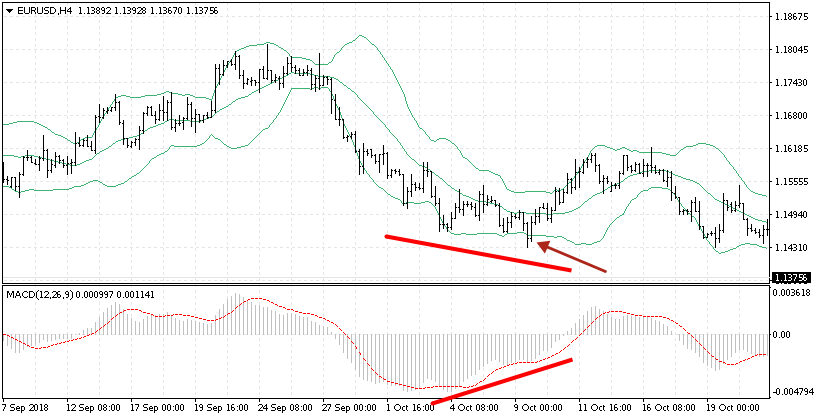
Advantages of the MACD
- The main advantage of the MACD indicator is that it includes elements of momentum and trend at the same time. In addition, MACD as a trend following indicator will not give false information for a long time. In addition, the use of moving averages ensures that the indicator follows the price movements of market instruments. If you use exponential moving averages instead of simple moving averages, then this will reduce the delay.
- As a dynamic indicator, the MACD is able to outperform the movements of the instrument being played. As a rule, MACD divergence is a key predictor of a trend change. A negative divergence usually indicates a decrease in bullish momentum and a possible change from bullish to bearish. Having received such an alarm signal, it is necessary to take profits in long positions (in case of aggressive trading, consider introducing short positions).
Disadvantages of MACD
- It is believed that both the linear MACD and the MACD histogram give too many false signals on intraday charts, and MACD indicators are best used on periods of a day or more.
- The MACD line indicator sometimes lags significantly in the formation of trend signals.
- As in most cases, the smaller the MACD settings , the more false signals the indicator gives, the larger the MACD settings , the more signals it misses. Naturally, there are no optimal MACD settings .
Use MACD in combination with other technical analysis tools
Many systems have been invented that include MACD in combination with other instruments. Most often, MACD divergence is used as a warning signal, and a specific entry point is chosen based on other indicators. Good results are shown by systems that combine the MACD and the usual resistance/support levels on lower timeframes. With this approach, properly chosen MACD settings and well-defined rules for entering/exiting a trade can significantly improve your trading.
FAQ on MACD
What is the MACD indicator on the stock exchange?
The MACD indicator predicts price movement by analyzing the indicators of the smoothed difference between the convergence/divergence of two moving averages. MACD in simple terms is the result of simultaneously evaluating the market with two different moving averages. It was originally developed for a moderately volatile stock market and is used to evaluate and predict price fluctuations. Stock market traders still use it in making investment decisions. MACD values ??are displayed on a separate chart, usually above or below the price chart.
How to set up the MACD indicator?
For H1 and neighboring timeframes, settings 12, 26, 9 are considered optimal. Many traders also use them for trading on daily charts. If you want to trade non-minimum timeframes, then for 5 and 15 minutes it is recommended to use the parameters 21, 31, 1. Three types of settings are considered effective on the minute timeframe: 13, 21, 1; 21, 34, 1 and 31, 144, 1. To improve the accuracy of forecasts, many traders add three indicators to the chart at once with the parameters indicated above.
How to use the MACD indicator?
There are many ways to use the MACD for trading. For example, at the intersection of lines, indicating a trend reversal. Similar, but more accurate, are the divergences of the extreme points of the price chart and the indicator. In this case, both moving averages and a chart can be used.
Pay attention to the position of the chart relative to the zero line. For example, its growth above zero indicates the strength of the trend, and its fall indicates its imminent completion. The movement of moving averages into positive or negative areas with a zero crossing is also taken by many traders as evidence of the strength of the current trend.
How does the MACD indicator work?
The fast line (MACD line) is a graphical interpretation of the difference between the original fast and slow moving averages. The difference between fast and slow EMA is also displayed as a chart. There is also a signal line on the chart (sometimes called a slow line). It is a simple moving average of the MACD line.
How reliable is the MACD?
MACD demonstrates good reliability on timeframes from H1 and above. But in this case, you should not use only this indicator. Almost all successful trading systems involve the use of several technical analysis tools that confirm each other's signals.
How can the MACD prevent false signals?
Many trading systems involve receiving signals from several instruments at once. MACD can be used as a filter (additional confirmation) for other indicators. You can also filter signals by analyzing the chart on different timeframes. For example, if you choose a daily chart where the histogram is growing in the positive zone, then only long positions should be opened on smaller timeframes. This approach will help reduce the percentage of false positives.
What is a signal period in MACD?
The signal line is a simple moving average from a fast one. Accordingly, the signal period is the length of the calculated moving average.
What is the MACD golden cross?
A golden cross is a situation when a short (fast) moving average crosses a long (slow) moving average from the bottom up. In most cases, such a signal is followed by a reversal of the market up. The reverse situation is called a dead cross. It occurs when a short moving average crosses a long moving average from top to bottom. This signal is a sign of an imminent downward reversal.
Is the MACD the most useful indicator?
MACD is one of the most useful indicators. That is why it is one of the standard tools of modern trading platforms. At the same time, it cannot be called some kind of holy grail that can guarantee profit under any trading conditions. The indicator has a number of limitations, among which the most obvious are: delays on short-term charts and an increase in the percentage of false positives in the flat.
What does a negative MACD mean?
The zone above the zero line is called positive, and below it is called negative. Therefore, a negative MACD is a situation in which the histogram is below the zero line.
What is the best timeframe for MACD?
MACD was originally designed to work on hourly charts. However, later it proved its effectiveness on other timeframes. It is believed that the best results can be obtained on charts from H1 and above.
What does MACD 12 26 9 mean?
12, 26, 9 are the standard MACD settings. The number 12 means the period of the fast moving average, 26 - slow, and 9 - signal. These settings were originally developed for hourly stock charts. However, over time, they showed effectiveness on other exchange instruments and timeframes, except for the smallest ones.
Is MACD a lagging indicator?
MACD really works with a slight delay. But many technical analysis tools have this drawback. Lag has almost no effect when trading on small timeframes. But on smaller graphs, the efficiency drops noticeably. Therefore, in scalping strategies MACD is used together with other instruments as a filter for faster signals.
Is the MACD a leading indicator?
The MACD gives both leading and lagging signals. For example, the crossing of moving averages and the zero line is considered a lagging signal. Divergence and oversold signal - leading. MACD gives a good signal for a trend reversal a few candles before the event.
Conclusion
The MACD Oscillator is a great tool for both experienced and novice traders. Last, for its full use, it is recommended to start working with it on a demo account. In addition to acquiring invaluable experience, this will help you gain certain statistics and develop optimal indicator settings.
When working with the indicator, you should keep in mind that the larger the timeframe of the chart on which it is built, the less false signals there will be, but the more trading signals will be missed. So look for the golden mean.
The simplicity of the interpretation of the strategy makes it accessible to beginners, the reliability of the signals is ensured by the use of one indicator, the ratio of profitable trades is above 70%. With the right alignment of trading tactics and the distribution of capital risk, the strategy is able to minimize losing trades.
And finally, like any other indicator of technical analysis, MACD requires confirmation. Do not make trading decisions based on the MACD alone, be sure to look for its confirmation by other indicators.
Useful External Links
Moving Average Convergence Divergence Indicator or MACD tutorial with MACD Histogram, MACD RSI, MACD Crossover, MACD Strategies