ATR Technical Indicator - How to trade successfully
This tool is the result of studies by Welles Wilder who noticed that high values of the ATR often appear during dips and so-called “panic” sales.
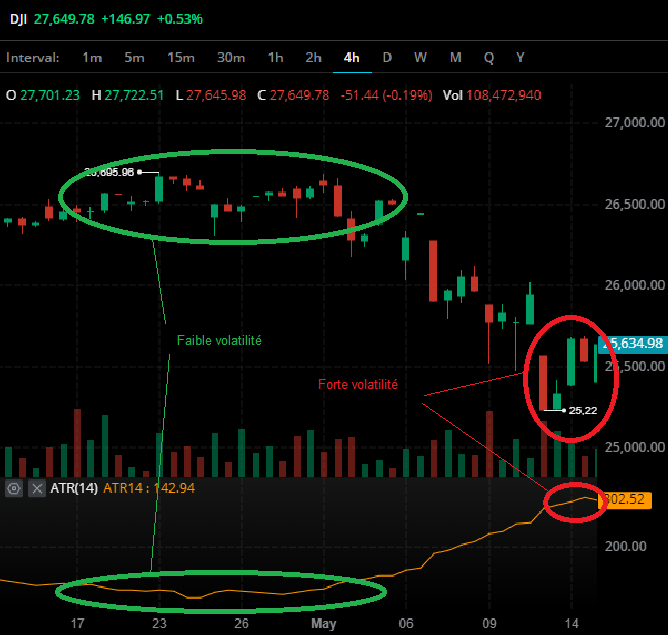
According to his findings, he also noticed that low values of the ATR generally go hand in hand with long periods of sideways price movements, such as are often seen at the time of the tops and after phases of consolidation.
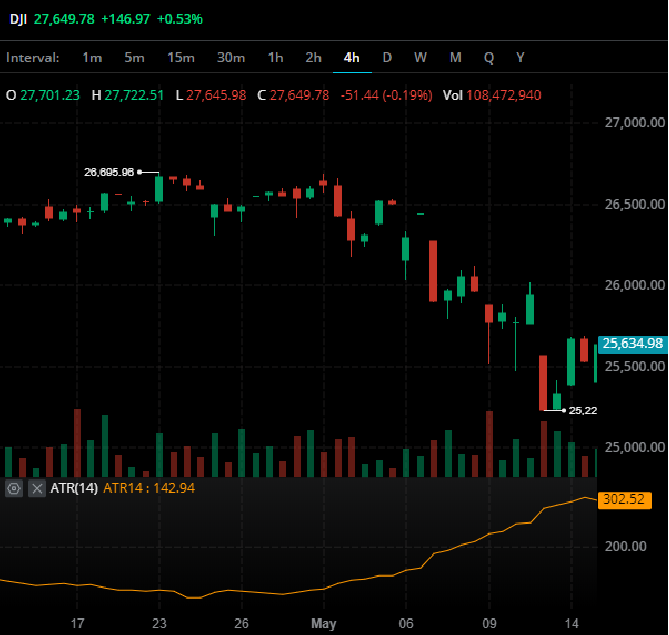
Indeed, as you can see in the graph below, the period of price stagnation is accompanied by a low value of the ATR indicator.
ATR an indispensable indicator for traders
Traders generally use several indicators to study the patterns, trends and reversals of financial markets.
All of these tools in technical analysis are used against a price chart, which is arguably the most important piece of information a trader can have.
In this sense the Average True Range indicator calculates the distance traveled by the price each day and plots it on a graph.
The interest of such an indicator is that it can be used by traders to determine the strength of a trend or a market reversal by verifying that extreme levels are reached, thus reinforcing the probability of a price reversal.
Thus, the ATR can therefore serve as a complementary indicator to confirm a price break with a support or resistance zone.
Indeed, for example if the Average True Range or ATR indicator increases near a support zone or the probability of a breakout is high, then the possibility that the prices will break out of the support also increases.
Normally, although it is often the case, the ATR should not be used to identify exit and stop loss targets because past volatility is not a predictor of future activity.
ATR, a powerful indicator for trading automatic
The Average True Range (ATR) indicator is particularly interesting for programming trading systems, as it allows you to program buy or sell signals using thresholds denominated in multiples of ATR.
For example, it is possible to program a buy signal if the price varies by more than 2*ATR upwards.
This indicator is used to trade on the forex market (Euro, US Dollar, Yen, etc.), crypto-currencies (Bitcoin, ethereum, Ripple, Litecoin, etc.) commodities (Oil, copper, gold, etc.) ), shares (Total, cap gemini, etc.) as well as indices (DAX, CAC40, Nasdaq Composite, Dow Jones, S&P, etc.).
ATR and the stock market
The Average True Range (ATR) is a technical analysis indicator that was developed by J Welles Wilder in 1978, it is published by Wells Wilder in his book, “New Concept in Technical Trading Systems”, he has since an integral part of many trading system indicators.
It was originally designed to assess the volatility of commodity trading prices, its use was later extended to the equity market.
To date, the ATR is one of the most commonly used technical analysis tools, it is used in many trading strategies.
Although the indicator was designed for trading commodities, it can also be used on other instruments, such as stocks and derivatives like stock futures and index futures.
What is the ATR indicator?
The ATR or Average True Range volatility indicator makes it possible to measure the volatility or the degree of variation in the price of a security by calculating the average between the peaks and the lowest of a stock market price.
Since the calculation is based on absolute prices rather than percentage changes, it follows that a higher priced asset tends to have a higher ATR than a lower priced asset.
The average true range is similar to historical volatility except that the atr uses an arithmetic rather than exponential moving average, which makes it less reactive than historical volatility .
How does the ATR indicator work?
Even if this indicator may seem quite complex in its approach, the calculation method is very basic.
Indeed, the principle of this indicator consists in taking the Moving Average of the “True Range” over a given period.
According to Welles Wilder, the volatility which is calculated from the True Range consists of taking the highest value of the following 3 deviations, namely (Closing price of the previous day - Low of the day) or (High of the day - Low of the day ) or (Yesterday's Close - Today's High) High volatility is one of the reasons why many traders around the world trade in the Forex market.
Formula or calculation method of the ATR indicator
The Average True Range (ATR) is simply the moving average of the True Range, calculated over a given number of sessions.
The Average True Range measures the volatility of a stock in absolute terms.
The Average True Range (ATR) indicator is calculated as follows: First, the TrueRange is calculated.
TrueRange formula = TrueHigh - TrueLowTrueHigh: This is the greater value between the closing price of the day before and the highest price of the day.
TrueLow: This is the lower value between the previous day's closing price and the lowest price of the day.
Secondly, the ATR is calculated by taking the average over a given period of the True Range.
Formula of Avg True Range (ATR) = Average (TrueRange,Period)
Interpretation of the ATR Indicator in trading
A large Average True Range indicates high volatility and a low Average True Range indicates low volatility.
This indicator does not make it possible to detect the direction of the courses but makes it possible to know if the amplitude of the movements is important.
It is important to know that the Average True Range indicator does not make it possible to compare the volatilities of the values between them, because a security with a high price will have, with equal variance, a higher ATR than a value with a lower price.
How to use ATR in the stock market?
The ATR is therefore used to measure volatility at time t.
As with bollinger bands , the ATR indicates low volatility during periods of market range.
When a sharp increase in the ATR follows, one should expect a rapid movement of the markets, such as during a gap in the bollinger bands .
One can use the Average True Range (ATR) indicator to measure the volatility of an asset (See example on the chart below), as is the case with bollinger bands , for example the ATR indicates low volatility during market range periods.
In the context of taking a position, the realization of seeing your trade operate is very strong, because as demonstrated by most charts representing low volatility, we often notice that a strong upward or downward movement is preceded by a period of low volatility.
These timeframes occur globally when the price moves within a range.
Conversely, a low value of the Average True range suggests a high probability of a bullish or bearish reversal.
The Average True Range is also widely used in risk management, ie in the context of your money management.
This indicator makes it possible to define in an absolute way the levels of the Stops of protection on the Futures contracts or on the Forex.
For example, if the volatility is high, it will be necessary to put a stop loss further in order to avoid seeing your stop affected by the volatility.
In this case, the ATR comes in a way to measure the noise of the market beyond which it is necessary to place its Stop orders to avoid “false signals”.
Another Example of using ATR
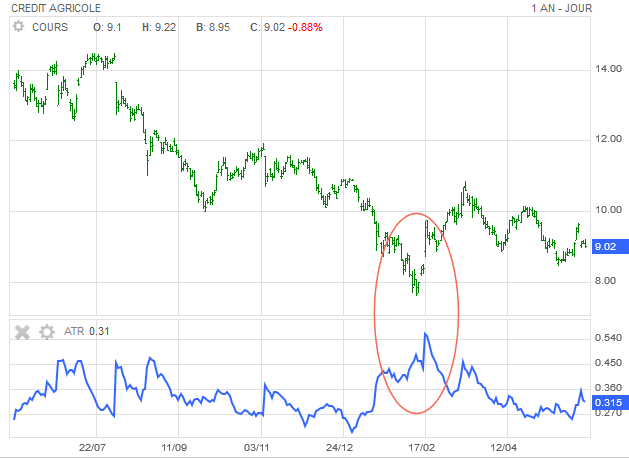
The graph below represents the Crédit Agricole share with the ATR indicator.
We can clearly see that as soon as the volatility increases on the value (area circled in orange), the indicator shoots up.
The interest is to detect these volatile phases which for Wilder are often preludes to major trend changes. In this specific case, this is also what happened to the title of Crédit Agricole which had hit a low point before rebounding violently for several weeks.
The ATR is in particular an indicator which makes it possible to measure the enthusiasm of the investors. We can consider that a bullish reversal in prices, associated with a sharply rising ATR, reinforces the conviction of the movement and vice versa on the downside, especially if the volatility soars during a support break.
Finally, note that the ATR is used by some indicators in their construction. These include the Keltner Bands which are based on the ATR to set their spacing, the Supertrend technical indicator or the ATR Trailing Stop of course. The latter is worth a detour to help you visualize the underlying trends and set “protection stops in a rational way.
How to configure ATR?
Welles Wilder recommends using a period of 14 days for its ATR indicator, which according to its designer who also studied astrology, would correspond to half of the lunar cycle or 14 days.
Advantages and disadvantages of the ATR indicator
The advantages of the ATR indicator
- The main advantage of the ATR indicator is that it is very easy to use and can give you very good entry and exit points if used with other indicators.
- Also, because of its simplicity, it can help you focus more on your technical analysis, as you don't have to worry about where you put your takeprofit.
- Another advantage of the indicator is that it does not take up much space on your stock chart, so it does not alter the reading of your technical analysis.
So you can use this indicator with all trading strategies and you don't have to worry about your chart getting too cluttered and confusing.
The disadvantages of the ATR indicator
- The disadvantage of the ATR indicator is that despite the relevance of its indications, the strength of the volatility given by the Average True Range does not really give entry signals that can be directly exploited.
- Indeed, it is often necessary to complete the signal given by this type of chart, using another technical indicator that will allow us to identify an interesting entry signal.
What you need to know and remember about the ATR indicator for trading on the stock market
The Average True Range or ATR indicator is not a tool that will be used to signal the trend or provide complete information on how the price chart is supposed to behave.
Nevertheless, the Average True Range indicator is unique in its kind, because it allows to calculate the volatility on the evolution of prices.
Used with trend-following and/or momentum -type technical analysis indicators, the ATR indicator provides valuable assistance to traders.
Summary
The ATR technical indicator was originally developed to measure the volatility of commodity trading prices before being used in all markets and financial instruments. Developed by J. Welles Wilder, this is in fact the moving average of the True Range indicator and is calculated over a determined number of sessions. With this indicator, traders can measure the volatility of a stock in absolute terms.


