Keltner Channel Strategy with Examples
keltner_channel keltner_bands keltner_channel_strategy keltner_channel_mt4 keltner_channel_indicator keltner_channel_mt5 keltner_channel_settings
Kelner Channel is often called as Keltner Bands also. In the article below, we'll use either of term.
Description of Kelner Channel
The “Keltner Bands” indicator was first introduced in the book “How To Make Money in Commodities” written by Chester W. Keltner. Subsequently, the indicator was developed by Perry Kaufman in his book “The New Commodity Trading System and Methods”. Belonging to the family of moving envelope indicators, the Keltner bands make it possible to frame the evolution of prices around the average price and according to the volatility.
Unlike “Bollinger Bands”, Keltner Bands are not based on statistical measurement like standard deviation but on volatility measurement based on the Average True Range indicator presented in the first section.
Calculation of Kelner Channel
1) Calculate the moving average at x periods: Average = MMA(Source, Period)
2) Calculate the Average True Range indicator which is part of the volatility measurement indicators.
AvgTrueRange = Average(TrueRange,Period),
where TrueRange = TrueHigh - TrueLow
- TrueHigh - the greater value between yesterday's close and today's high.
- TrueLow - the lower value between the previous day's close and today's low.
3) We can calculate the high band and the low band:
- The high band = Average + Factor x AvgTrueRange
- The low band = Average + Factor x AvgTrueRange
With factor: the numerical value making it possible to obtain a greater or lesser deviation from the mean.
Differences Between Keltner Bands And Bollinger Bands
The main difference between Keltner Bands and Bollinger Bands is actually the method of calculating the bands . Keltner bands use the volatility calculated by the ATR while Bollinger bands use the standard deviation.
Obviously, during an upsurge in volatility, the two bands move apart, but the Bollinger bands tend to move apart much more than the Keltner bands (with a standard deviation of 2).
| Indicator | Ketner Bands | Bollinger Bands | Envelope |
|---|---|---|---|
| Moving average | Simple moving average of typical price (high+low+close)/3 | 20 period single | Simple moving average |
| Bands | 2 x ATR 10 periods | 2 standard deviations from the mean | % variation from the mean |
Reading Signals from Keltner Channel
- Buy Signal: Prices make a small low outside the lower keltner then a small high inside this time. This feature signals the potential start of the upside.
- Sell Signal: Prices make a small high outside the upper keltner then a small low inside this time. This feature signals the potential start of the decline.
A price movement that originates on the edge of a band always tends to seek the other edge of the opposite band.
It can be noted that if the price does not touch the upper/lower limit on a higher or lower, the price will then go directly towards the opposite terminal.
Keltner Channel Trading Strategies
Among many Keltner Channel trading strategies, the most common are:
- Trend Pullback Trading Strategy with Candlestick Entry Signals
- Breakout Trading Strategy
1. Trend Pullback Trading Strategy with Candlestick Entry Signals
This trading strategy depends on the direction of the current trend. Trend trading is undoubtedly the most reliable form of trading because the momentum in terms of trading volume and volatility of a certain currency pair or asset tends to stay in a particular direction for a long time. .
Of course, when a trend is identified (bullish or bearish), we must wait for specific criteria of high probability of price movement to occur before deciding to execute a buy or sell market order with a signal. candlestick entry. This strategy incorporates candlestick patterns as entry signals, as they provide valuable information about an asset's price movements. This allows traders to quickly interpret price information from just a few price bars.
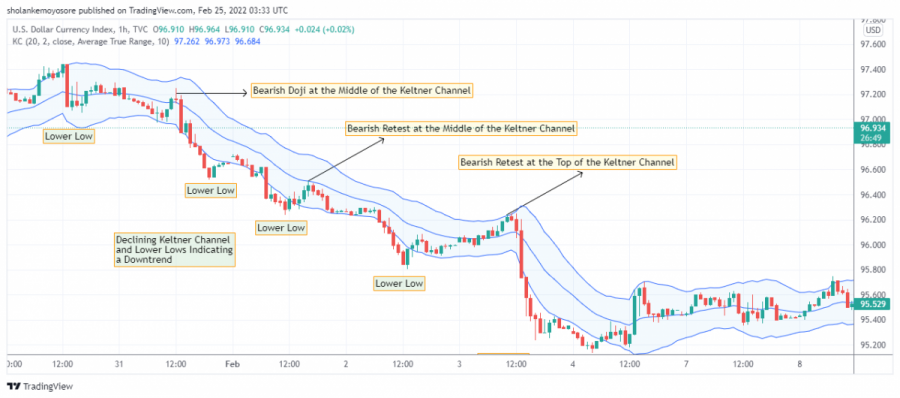
The high probability criteria and requirements for trading alongside a downtrend using the Keltner Channel are as follows.
- First, you need to identify a downtrend by the falling slope of the Keltner Channel.
- When a downward price movement is confirmed, the next step is to anticipate pullbacks or retracements of the downward price movement.
- The pullback or retracement should reach the midline or slightly above the midline of the channel before considering executing a sell market order.
- At midline or slightly above midline. Execute a sell market order when forming a bearish candlestick entry pattern. The most powerful candlestick entry patterns include the Bearish Doji, Bearish Engulfment, Bearish Pinbar, Bearish Hammer, and a Bearish Order Block.
- Place a stop loss just above the bearish candlestick entry pattern.

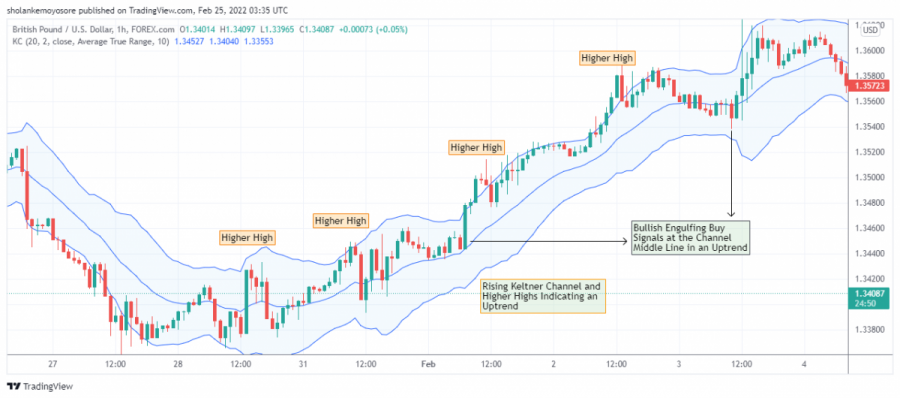
The high probability criteria and requirements for trading alongside an uptrend using the Keltner Channel are as follows.
- First, you need to identify an uptrend by an elevation in the slope of the Keltner Channel.
- When an upward price movement is confirmed, the next step is to anticipate the pullbacks and retracements of the upward price movement.
- Pullbacks or retracements should reach or slightly below the midline of the channel before considering executing a long market order.
- At midline or slightly below midline. Execute a long market order at the formation of a bullish candlestick entry pattern. The most powerful candlestick entry patterns include the Bullish Doji, Bullish Engulfment, Bullish Pinbar, Bullish Hammer, and a Bullish Order Block.
- Place a stop loss just below the bearish candlestick entry pattern.
2. Breakout Trading Strategy
This strategy is based on the general concept of the market volatility cycle. The Keltner Channel is well known for its breakout prediction of future price movement from a consolidating or sideways market.
Despite being a lagging indicator, its breakout signals are more accurate because it derives its reading from price movement and price volatility.
The Keltner channel tends to contract and move in a straight direction whenever price moves sideways or consolidates.
Based on the concept of market volatility cycles, a sideways consolidation usually precedes an explosive price expansion.
To capture the upward price expansion of a consolidation, open a long market order at the breakout of the upper channel line and conversely to capture the downward price expansion of a consolidation, open an order short at the breakout of the lower line of the Keltner Channel.
Key points to remember
- Keltner Channels are volatility-based bands that are placed on either side of an asset's price and can help determine the direction of a trend.
- The exponential moving average (EMA) of a Keltner channel is usually 20 periods, although this can be adjusted if desired.
- The upper and lower bands are usually set twice the average true range (ATR) above and below the EMA, although the multiplier can also be adjusted based on personal preference.
- Price reaching the upper band of the Keltner Channel is bullish, while reaching the lower band is bearish.
- The angle of the Keltner Channel also helps identify the direction of the trend. The price can also oscillate between the upper and lower bands of the Keltner channel, which can be interpreted as resistance and support levels.
Limitations of Keltner Channels
- The usefulness of Keltner channels largely depends on the parameters used. Traders must first decide how they want to use the indicator and then set it up to help achieve that goal. Some of the uses of Keltner channels, discussed above, will not work if the bands are too narrow or too far apart.
- Although Keltner Channels can help identify trend direction and even provide trading signals, they are best used in conjunction with price analysis, fundamentals if you are trading long term, and other technical indicators.
- The bands may also not serve as support or resistance and they may appear to have little predictive ability. This could be due to the settings chosen, but there is also no evidence that price moving two ATRs or hitting one of the bands will result in a trading opportunity or anything significant happening.
Keltner Channel for Metatrader 4 (MT4) Download
You may download Keltner Channel for MetaTrader 4 from here.
Conclusion
Keltner bands are a very interesting tool for spotting volatility peaks that often correspond to powerful movements. In any case, these are situations where you have to come and see what is happening.
In the situations we saw above, Keltner will effectively identify trend reversals.
In everyday use, when prices remain wisely within the bands, the bands will serve as support and resistance and will allow you to set price targets. In situations without a trend, with moving averages and horizontal bands, we can also play volatility to trade back and forth between the two limits.
Useful External Links
Keltner Channel strategy, settings and indicator download for Metatrader4 mt4, MetaTrader5 mt5
