Ease of Movement (EOM) Indicator Tutorial and Strategy
Ease_of_movement_indicator
The Ease Of Movement was developed by Richard W. Arms and described in his book “Cycles and the Stock Market”. By associating the variation of prices and volumes, this indicator expresses the quantity of volumes necessary to move prices up or down. Thus, Ease Of Movement seeks to determine how easily or how hard the market can go up or down.
Calculation method for Ease of Movement
Ease Of Movement = 100 * Market Facilitation Index * ((Higher + Lower) - (Higher + Lower in n-1)) * 0.5;
where:
Market Facilitation Index measures the efficiency of a price movement by quantifying price changes per unit volume.
The calculation of the indicator is as follows:
Market Facilitation Index = (Highest - Lowest)/Vol * 100
Interpretation of Ease of Movement Value (Ease of Movement Indicator)
The Ease of Movement Value can be displayed as a histogram, a simple line, or a combination of a histogram and a line. Each option has its pros and cons, but in the opinion of the author, the most successful option is the histogram.
EMV, Ease of Movement Value is a mirror of the current state of the market. Understanding the essence of the histogram, you can not only create a profitable trading strategy, but also conduct a more meaningful, in-depth analysis of the situation with the trading instrument.
Interpretation of the market situation using EMV, Ease of Movement Value (Ease of Movement Indicator):
- If Ease of Movement is growing, it means that volumes are low and prices are rising. This suggests that a reversal is likely in the near future.
- If the Ease of Movement is falling, it means volumes are low and prices are falling. This suggests that a reversal is likely in the near future.
- If the Ease of Movement fluctuates close to zero, this means that there is uncertainty in the market. Significant volume is needed for a serious movement.
- Correct understanding of the above rules will make your trading system very stable and profitable. Think!
Example of Ease of Movement Indicator Signals
There are two ways to use the indicator in a practical plane: apply it as a filter to the main strategy, determining only the direction for future transactions, or use it to the fullest as a signal indicator.
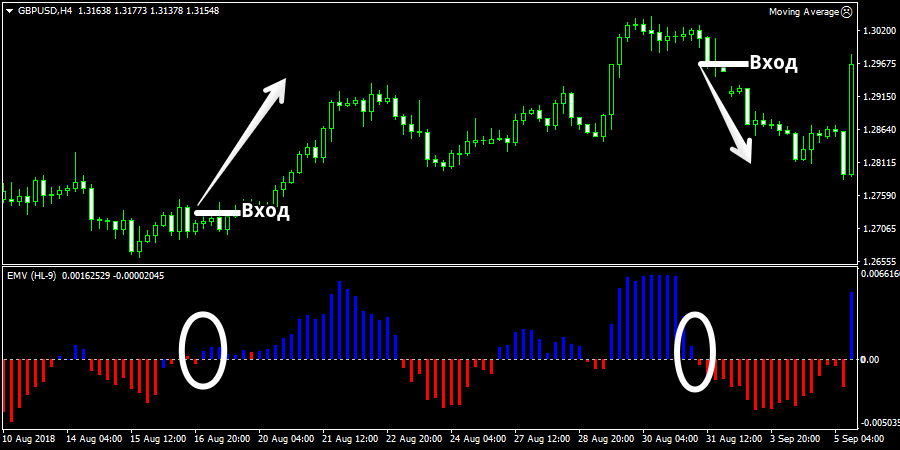
In the first case, to assess the direction of the trend and use it as a filter, it is enough to look at the color of the histogram and its location relative to the horizontal line 0.00.
An uptrend is determined by the indicator when the histogram is above 0.00 and turns it blue. A downtrend is determined by the indicator when the histogram is below the 0.00 level and turns red.
When using EMV to find a market entry point, you should fix the trend change directly.
So if the histogram crosses level 0 from the bottom up and changes its color from red to blue, we open a buy position. If the histogram crosses level 0 from top to bottom and changes its bar color from blue to red, we open a sell position.
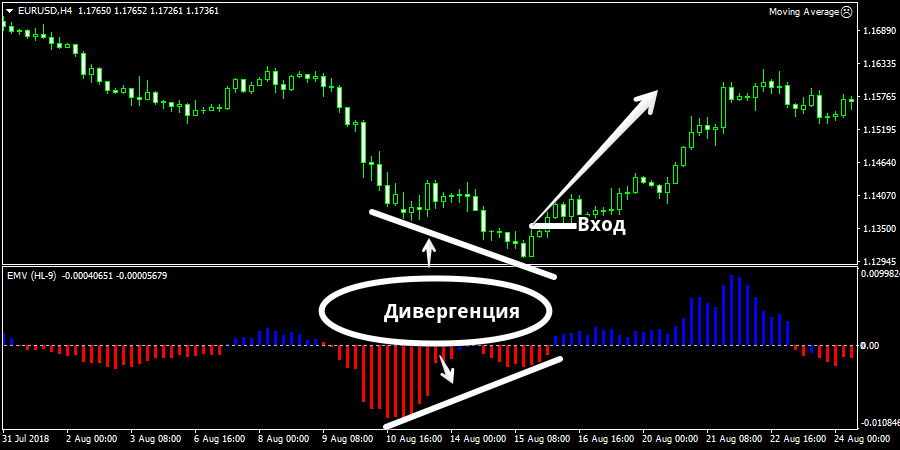
Also, Ease of Movement Value can show a leading trend reversal signal, better known as divergence .
The discrepancy manifests itself in the fact that the price, updating its peak, is displayed by the indicator histogram as lower than the previous one, and when updating a new low, the instruments show that it is not lower than the previous low.
So that you can understand what the divergence looks like, we suggest taking a closer look at the image below:
In the settings in the line in the MA period variable, you can change the calculation and averaging period of the indicator, and in the MA mode line, you can specify what type of moving average to average data on.
The Mode line allows you to change the type of data display from a histogram to a simple line.
In conclusion, it is worth noting that the Ease of Movement Value indicator is one of the few oscillators that displays not only the dynamics of price changes, but also attracts price volume for this.
Trading strategy with the ease of movement indicator on the stock market
- Buy when the moving average of the ease of movement indicator crosses above the zero line.
- Sell when the moving average of the ease of movement indicator crosses below the zero line.
These two signals can be used as entry and exit points (Or go long, and exit short).
Example: You buy, with the buy condition and you wait for the sell condition to sell
Advantages of the ease of movement indicator
The advantages of the ease of movement indicator
- The ease of movement has the advantage of being an easy-to-use indicator and will prove to be very useful for following trends.
- By optimizing the strategy with protective stops, for example, it should however be possible to get much better out of it.
Disadvantages of the ease of movement indicator
The ease of movement should not be used alone but in combination with other indicators, because in range trading periods it gives off many false signals.

