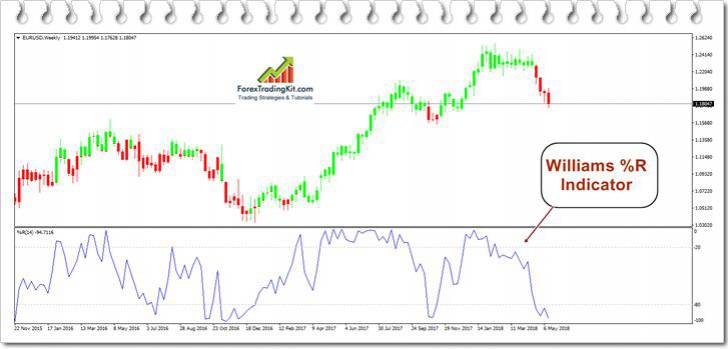
Guide to Williams %R – Percent Range (Williams Percentage Range)
Williams’s percentage range (Williams% R sometimes referred to as Williams Overbought / Oversold Index or Williams Percent Range) is a simple but effective price movement oscillator that was first described by Larry Williams in 1973. It shows the closing price level relative to the high-low range for a certain period.
Williams’s percentile range (Williams% R) is a dynamic indicator that works similar to the Stochastic oscillator (only Stochastic compares the closing price to the minimum for a certain period). In particular, it is very popular for assessing overbought and oversold markets.
Formula of Williams %R :

Where:
Hhigh – the highest maximum for a certain time, for example, 14 periods.
Llow is the smallest minimum for a certain time, for example, 14 periods.
Close is the closing price.
Usually, Williams% R is calculated using 14 periods and can be used for intraday, daily, weekly and monthly data.
The time period of calculation (minute, hour or day candles) and the number of periods for calculation can be different, depending on the required sensitivity of the indicator and the individual characteristics of the currency, security or commodity.
The values of the indicator range from 0 to -100.
Example of Williams %R

Description of the Williams’ percent range :
Each price is an indicator of the equilibrium of the market crowd at a given moment in time.
The maximum of the current price range shows the maximum strength of “bulls” or buyers. The minimum range shows the maximum strength of “bears” -sellers throughout the entire trading range. The most important indicator is the closing price, which shows which of the groups (buyers or sellers) won in this period, and how much this victory is significant. Williams% R compares each closing price with the last trading range, and indicates whether the bulls can close the price closer to the maximum of the range or the bears are stronger and they will be able to close the price at the minimum of the trading range.
If bulls can not close the market near the maximum of the range with the existing uptrend, then they are weaker than they seem, and this creates an opportunity for sale. If bears are unable to close the market near the lows during a downtrend, then they are weaker than imagined, and this gives an opportunity to buy.
In the indicator Williams %R, this is expressed as follows:
- if the closing price is close to the maximum of the range, then the indicator will be near zero (the maximum value of the indicator);
- if the closing price is near the minimum of the range, the indicator will be as close as possible to -100 (the minimum value of the indicator).
How to use Williams %R:
Divergence signals
Divergences between the asset price and Williams% R occur rarely, but are the strongest signals of the Williams% R indicator.
If the price rises to a new high, which is higher than the previous one, and the Williams% R indicator makes a new high, but below the previous one, it is a negative or bearish divergence and a sell signal.
If the price falls to a new low that is lower than the previous one, and the Williams% R indicator makes a new low, but above the previous one, this is a positive or bullish divergence and a buy signal.
Overbought and oversold signals
Another way to use Williams% R is to define overbought and oversold conditions .
The overbought condition occurs when Williams% R becomes higher – 20. Entering the zone above -20 is a sell signal.
The oversold condition occurs when Williams% R becomes below -80. Entering the zone below -80 is a buy signal.
It is important to remember that overbought does not necessarily entail the need for a transaction to sell, and oversold transactions for purchase.
The market can be, for example, in a downtrend, and the indicator in this case will go into the oversold zone and stay there for a long time, as the price moves lower and lower.
Therefore, when the market conditions are overbought and oversold, the trader should wait for the signal to change the direction of the trend. One of the methods is that you can wait for the Williams% R indicator to either exit the overbought zone (cross the -20 from top to bottom) and oversold (cross the -80 value from the bottom up) or just cross the -50 value from one side.
Confirmations of a turn can be given by other indicators or methods of technical analysis.
Signals of the trend entry
One way to use Williams% R can be to determine the main trend, and then search for trading opportunities in the direction of this trend. In an uptrend, traders can wait for the indicator to enter the oversold zone to open long positions. In a downtrend, traders can wait for overbought to create short positions.
Williams% R code for TradeStation, Dealing Desk, MultiCharts
Inputs: Length (14);Variables: WilliamsR (0); Williams R = ((Highest (H, Length) -C) / (Highest (H, Length) -Lowest (L, Length))) * (-100); Plot1 (WilliamsR, "Williams% R"); Plot2 (-80, "Oversold"); Plot3 (-20, "Overbought");