Detrended Price Oscillator Tutorial with Strategy
Detrended_Price_Oscillator Detrended_Price_Oscillator_Tutorial Detrended_Price_Oscillator_Strategy Detrended_Price_Oscillator_Example Detrended_Price_Oscillator_for_MetaTrader4 Detrended_Price_Oscillator_for_MetaTrader5
The Detrended Price Oscillator, better known as DPO, is certainly not among the most used and frequent in trading, yet it can provide an important contribution to the technical analysis of traders who decide to use it to deepen the study of financial markets.
The DPO indicator is used to eliminate price trends from the price charts, with the aim of identifying the historical cycles that characterize trading: this means that the Detrended Price Oscillator allows us to complete our technical analysis thanks to a cyclical overview. of the market.
Below is an explanation of what the DPO indicator is and how it works .
DPO (Detrended Price Oscillator) indicator: what is it?
The Detrended Price Oscillator is a technical analysis tool which, based on the trend of the prices examined, finds its “center of gravity” on the value 0. This indicator highlights the price levels, with the aim of estimating the duration of the price cycles. Starting from the short-term cyclical analysis, it helps us to identify long-term cycles.
What is the DPO indicator used for?
The DPO indicator does not provide buy or sell signals following oversold or overbought phases, as occurs for example with the stochastic oscillator or MACD, but it lags behind prices due to its suitable nature. to “detrend” the graph. It is therefore proposed as an excellent tool intended to enrich technical analysis, not to replace other algorithms.
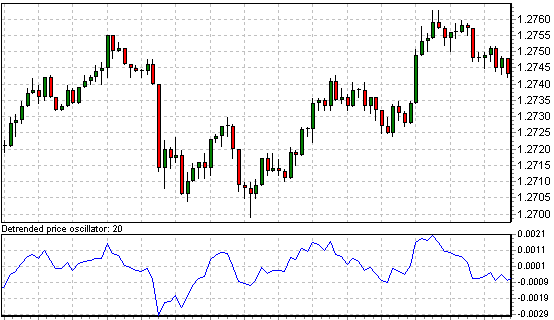
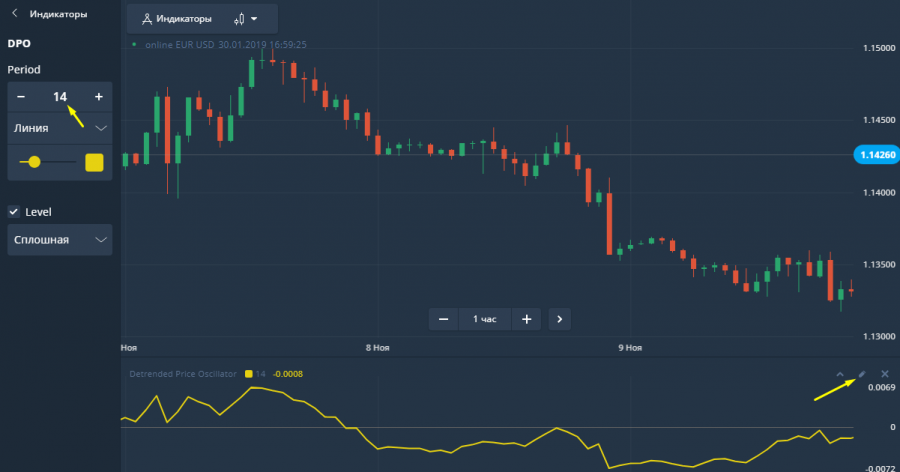
Here is a graphic example of the DPO or Detrended Price Oscillator indicator:
The Detrended Price Oscillator measures the difference between a moving average and the price in the past, consequently the DPO indicator will appear shifted to the left of the current price. This will swing above and below 0 just as the price gravitates around the moving averages.
How is the DPO indicator calculated?
The DPO indicator is composed of a moving average x periods, generally of 20 or 30, shifted back by x / 2 days +1.
DPO = close - moving average ((x / 2) +1)
Not all trading platforms have the Detrended Price Oscillator by default, but in any case it is easy to find it on the web and proceed with its installation.
What is DPO Detrended Price Oscillator and how does it work
The Detrended Price Oscillator is a technical indicator that is part of the oscillator family. Based on the trend of the various quotes that have been examined, this oscillator moves around the midline of zero. This particular technical indicator then highlights the ups and downs of price levels, estimating the length of price cycles. Through cyclical analysis it is therefore possible to identify the long-term cycles of the market.
However, the DPO indicator does not provide either buy or sell signals . It therefore behaves in a profoundly different way compared to other much more famous technical indicators, moving behind the prices, thanks to its nature that tends to “remove the trend” from the chart. It is therefore an indicator that does not replace the work of the other indicators, but could rather be a perfect solution for those who want to integrate existing technical indicators within their trading plan.
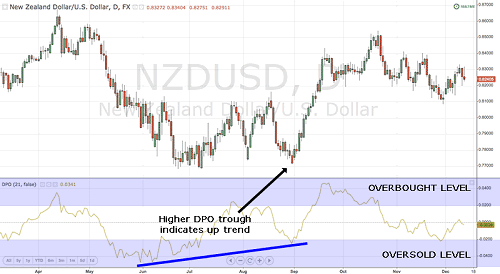
Here is how the DPO indicator is represented:
As you can see, through the overbought and oversold levels , it is possible to derive the trading signals. A high DPO represents an uptrend, while a low DPO indicates a downtrend. Technically, the Detrended Price Oscillator measures the difference between the moving average and past prices , this means that it is a “lagging” type indicator, that is, it is not aligned with the current price level and therefore slightly shifted to the left with respect to the current price. The Detrended Price Oscillator then fluctuates above and below zero, in the same way that the market price fluctuates above or below the moving average.
How does the DPO Detrended Price Oscillator work?
This indicator has one interesting feature that makes it different from other oscillators. It ignores the impact of the trend on market cycles. This means that when you are looking for an entry point for a short-term price reversal, this indicator will not take into account the main trend in its calculations.
So, the well-known stochastic oscillator periodically gives false signals, at the moments of pronounced trends, when its lines “stick” for a very long time beyond the 80 or 20 zone. only in consolidation areas, but also during trending market movements.
The Detrended Price Oscillator tool perfectly filters trends, breaking them into fluctuations.
How to install Detrended Price Oscillator on MetaTrader 4 or MetaTrader 5?
- Download Detrended Price Oscillator for MetaTrader 4 and MetaTrader 5 from links below.
- Launch Terminal and open the File menu.
- Run through “File” the MT data directory.
- Find the “MQL” folder in the directory and open it.
- Copy to the subfolder of the data directory where the indicators are stored, the file of our tool.
- Restart terminal.
After you install the indicator in the terminal, it can be found in the navigator window. It remains only to drag it to the chart by holding the left mouse button.
After you install the indicator, it will appear in the lower “footer” under the main chart. DPO looks like a line that goes between the main overbought and oversold levels. All calculations are based on closed candles, i.e. at closing prices.
The oscillator formula is the difference between the closing price of the previous candle and the average closing price for the indicator period. The period can be set in the input parameters.
The settings are very simple, and there are only two of them:
- Period MA. This indicator is for calculating the moving average period. Initially set to 14. You can set other values ??depending on what timeframe you are using. Smoothing the average is equal to 50% of the cycle value + one candle. Anti-aliasing at 21 is considered the best.
- Bars To Count. The number of extreme candles that the indicator will take into account in its work. Initially 400. The strength of smoothing of the main line of the indicator, and hence the number of entry points, will depend on this parameter. If you reduce the indicator, the number of signals will decrease, but they will become more accurate.
You can also set up and specify your own indicators of the levels at which the instrument will show overbought and oversold conditions. If you are still a beginner, then you should not change anything in this variable.
Forex indicator DPO: how to use?
The indicator displays not only the levels where the price is overbought or oversold, but also the zero (neutral) line. It is drawn as a dotted line, and it is assumed that an approximate balance between buyers and sellers has been achieved on this line.
Zero line trading
The indicator generates more than one type of signal per entry point. The easiest way to trade using the indicator is to analyze the position of the main line in relation to the zero level:
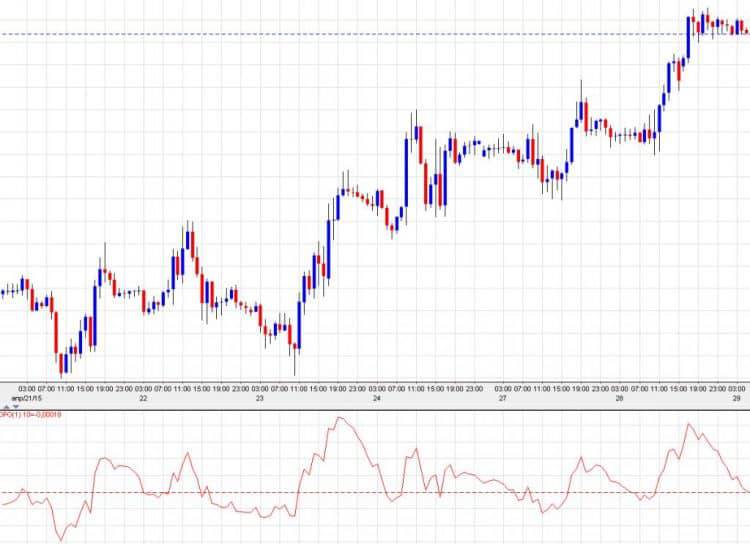
- If the main line is above zero, then this indicates the dominance of buyers in the market. It is possible to open buy deals.
- If the main line is below zero, then this indicates that sellers dominate the market. It is possible to open deals for sale.
However, this kind of signal is not very reliable. It is much more reliable to trade from zones where the price is overbought or oversold.
This tool can be used to filter signals when working with the Stochastic strategy based on a well-known oscillator.
Trading from critical zones where the asset is overbought or oversold
Market entries in this variation are much more certain. The opening of a transaction occurs when the market is “overheated” and the power of buyers or sellers that move the price weakens, the reversal point is approaching.
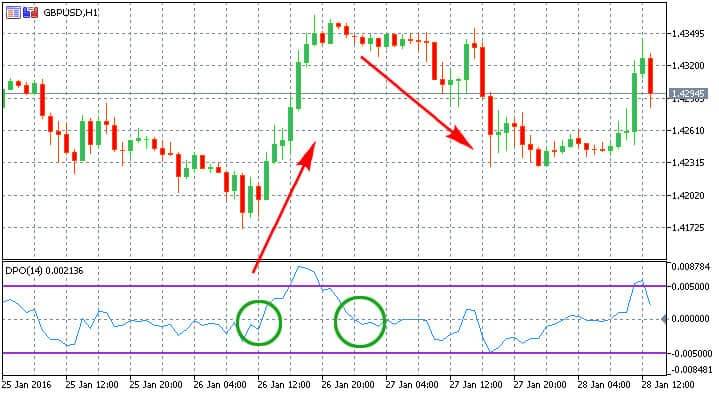
A long trade occurs when the signal line breaks through the oversold level and goes to the upper overbought border. The signal will increase if you combine the indicator with other trading systems, for example, add resistance and support lines to the chart and further navigate by their signals.
A sell trade is opened when the signal line of the indicator breaks through the overbought level and goes down to the lower border of the oversold zone. The deal will be more reliable if the price bounces off the resistance level.
Important! It happens that there is a protracted trend in the market. Here it is important for you to catch the turning point of the market. Most often, such a point will be a new high or low, when the price makes the last throw in the direction of the trend. After redrawing the high or low, the price enters the zones where the price is overbought or oversold, and a reversal occurs.
In order to filter entry points from the indicator, it is recommended to apply resistance and support levels. They will help you trade. Levels are built on extremums, local price reversal points. Bollinger Bands can also be used as floating levels.
Points for closing a position
Trades can be closed either by take-up or by the opposite signal from the instrument. If you use take profit, then you need to set it at the nearest level. For example, if you were buying, then you need to exit the market on the take-up at the nearest resistance level. If you were selling, then you need to take profits at the nearest support level. This approach carries the least risk.
If you close deals manually, be sure to use a trailing stop! And the deal must be stopped when the instrument reaches the opposite boundaries, where the price will be either overbought or oversold.
For example:
- The sell position should be closed when the instrument enters the zone where the price is oversold.
- A long trade should be closed immediately, as soon as the instrument enters the zone where the price is overbought.
However, it happens that the price freezes in zones where the price is either overbought or oversold, and the trend continues. A trailing stop with a short step will help out here. He will squeeze out the maximum profit.
Strategy based on the DPO indicator
Like other oscillators, this indicator will show itself best during a flat, or when the price is clearly moving within one price channel. However, our indicator has a built-in trend filtering system, and therefore, it is quite possible to use it with a pronounced trend.
The indicator is suitable for any assets and any time intervals. The higher the graph, the more accurate the signals will be. On smaller timeframes such as M5 and M1, the accuracy of the indicator will decrease because there will be market noise in the market.
This indicator should not be used alone. It can be combined with support and resistance levels, trend lines, as well as trend indicators.
Trading system based on levels, Stochastics, and DPO
This strategy is multicurrency. Any timeframe from M15 is suitable for trading. It is better not to use it on low TFs - there will be many false signals.
You need to install Stochastic and DPO on the chart. We leave the settings for both indicators as standard.
Then you need to plot the support and resistance levels on the chart. They are built on local price reversals, local highs and lows.
Sell entry point:
- The DPO indicator, having entered the overbought zone, broke it down.
- Stochastic is currently trading in the overbought zone, or it has broken through it from top to bottom.
- The price of the asset has reached the resistance level.
When all three components of the entry point coincide, it is worth opening for sale. Stop loss is placed behind the latest price extremum. Take profit is placed at the nearest support level, or at the distance of the stop loss, multiplied by two. It is also possible to exit the trade on a trailing stop, and move the stop to the breakeven trading level.
Terms for purchases:
- The DPO indicator entered the oversold zone and exited it, breaking it upwards.
- Stochastic has broken through the oversold level from the bottom up, or is in the oversold zone.
- The price bounced off the support level.
Stop loss and take are set in the same way as when selling.
Important! Do not use the DPO indicator alone, in its pure form. The best way to add an indicator is to trade using the levels, according to the TS described by us.
Strategy based on Fractals by B. Williams and DPO
This technique is scalping and is suitable for working within the price corridor, when the price moves calmly, periodically bouncing off the upper and then the lower border (level).
To trade, add the fractal indicator developed by Bill Williams to the chart. It's called Fractals and should be built into the terminal tools package. To filter transactions, set the DPO indicator. Leave all parameters as standard, chart timeframe - M5.
Trade will be short-term. Your goal is to open several trades with an average profit. The total profit in the end should be rather big.
Trades will be opened at the points where the price turns in the opposite direction. This will be indicated by the appearance of a fractal indicator signal (recall that it looks like an arrow pointing down or up) and DPO entering the critical zone.
So, you can enter a long position provided that:
- A fractal appeared on the chart under a local minimum. Arrow pointing up.
- DPO is in the oversold zone and intends to break through its level from the bottom up (or has already broken through this mark).
Stop loss is placed on the signal fractal. Profit is fixed at a take profit equal to two stops.
You can open a short position with reverse signals:
- A fractal signal appeared on the chart above the local maximum. The arrow is pointing down.
- DPO is in the overbought zone and is going to break through this level from top to bottom (or the breakout has already happened).
We put a protective stop above the local maximum - behind the signal arrow. The take profit size is equal to two stops.
The non-trending DPO oscillator is an indicator for trading not only in a trend, but also in a flat zone. In this way, this tool compares favorably with other indicators from the oscillator group. We recommend that you test it on different currency pairs and under different market conditions in order to practice correctly interpreting incoming signals.
To determine trend cycles, we recommend installing the Schaff Trend Cycle indicator .
Download Detrended Price Oscillator
Useful External Link
Detrended Price Oscillator on Wikipedia
Detrended Price Oscillator Tutorial, Strategy, Example, Download for MetaTrader4 and MetaTrader5
