Commodity Channel Index Tutorial, CCI Trading Strategy with Examples
cci_trading cci_stock_indicator commodity_channel_index_indicator cci_indicator_formula cci_trading_strategy commodity_channel_index_strategy cci_forex commodity_channel_index_formula
The Commodity Channel Index is a technical indicator of the family of oscillators developed by Donald Lambert.
Originally, this indicator was designed to identify cyclical reversals in commodities, however its use was extended to equity markets and then to others such as forex thereafter.
The CCI measures the price variation around the average of “typical” prices. This indicator estimates that the price moves in a cycle with highs and lows appearing at regular intervals.
Donald Lambert recommends using 1/3 full cycle for the CCI calculation period. The shorter the CCI period, the more nervous and volatile the indicator will be.
Finally, note that the CCI consists of a curve and two limits (+100 and -100).
Despite its name, CCI is not only an indicator for commodities. It can also apply to assets, stocks, Bitcoin and other cryptocurrencies, etc.
Calculation of Commodity Channel Index (CCI)
1. Find a typical price. To do this, you need to add the high, low and closing price of each bar and divide the sum by 3.
TP = (HIGH + LOW + CLOSE) / 3
2. Calculate the n-period simple moving average of typical prices.
SMA(TP, N) = SUM(TP, N) / N
3. Subtract the resulting SMA (TP, N) from the typical TP prices of each of the previous n periods.
D = TP - SMA (TP, N)
4. Calculate the n-period simple moving average of the absolute values ??of D
SMA(D, N) = SUM(D, N) / N
5. Multiply the resulting SMA (D, N) by 0.015
M = SMA (D, N) * 0.015
6. Divide M by D
CCI=M/D
where:
HIGH — maximum bar price;
LOW — minimum bar price;
CLOSE — closing price;
SMA - simple moving average;
SUM - sum;
N is the number of periods used for the calculation.
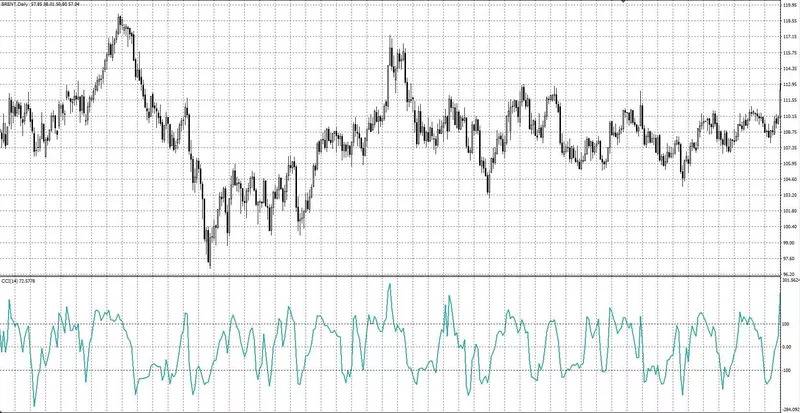
Graphic representation of the Commodity Channel Index (CCI)
Its appearance is as follows:

Commodity Channel Index (CCI) Trading Signals
If we talk about what signals it gives, then everything is actually very simple.
- long trades are opened when the indicator rises above +100
- long trades are closed when the indicator falls below +100.
- short trades are opened when the indicator falls below -100
- short trades are closed when the index rises above -100
Commodity Channel Index (CCI) Trading Strategy
The CCI measures the difference between the change in the price of an asset and its average price change. Traders typically use the indicator in three different ways: divergence, trend, and overbought and oversold levels. More advanced traders can, via the CCI, interpret the strength of the trend, as well as the probability of a reversal of the main trend.
Commodity Channel Index (CCI) Overbought and oversold levels
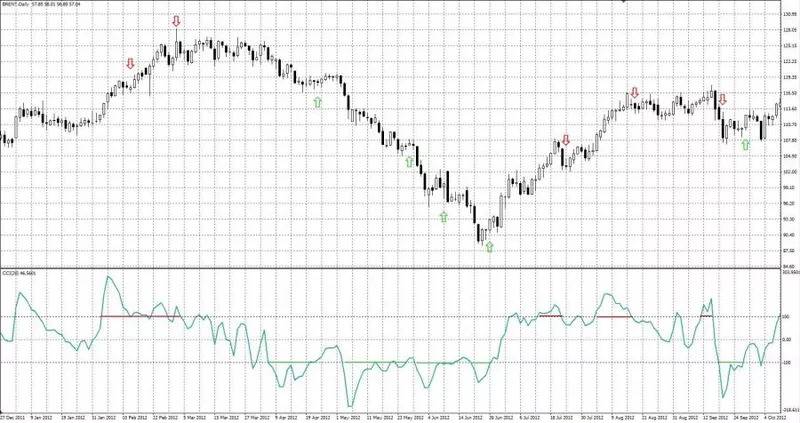
The overbought and oversold levels are the +100 and -100 levels respectively. Based on this use of the indicator, a trader should be alert whenever the indicator breaks above the value of +100. At that time, the asset is overbought and at any time it can reverse its trend. Conversely, if the CCI is below -100, the asset in question is considered oversold. The trader or the analyst must be attentive to these values ??because at any time the downtrend could turn into an uptrend. Below is an example with this use on the price of Brent oil.

As we see, the indicator gives many failures when interpreting this type of signals. This does not indicate that these signals are not working, but on this asset they probably are not working. It does, however, reveal the rationale for the interpretation made by more advanced traders. As we stated earlier, more advanced traders are able to interpret the strength of a trend with this indicator. Its interpretation is governed precisely by a usage contrary to the current one. If the indicator is above 100, the uptrend is strong. If it is below -100, the downtrend is strong.
Commodity Channel Index (CCI) Trend indicator
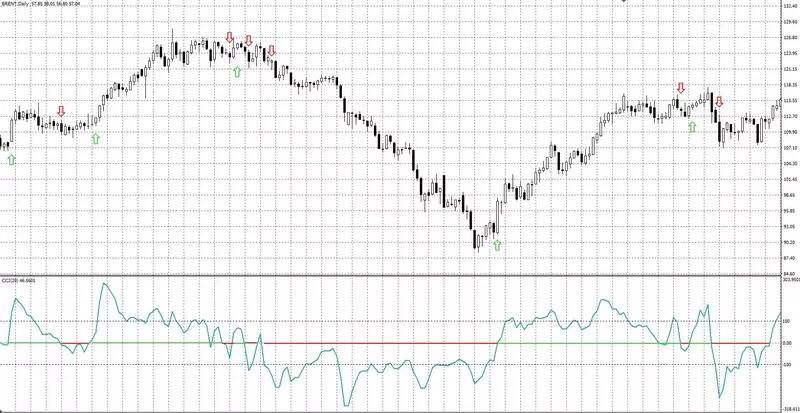
According to this interpretation, a financial asset is in an uptrend if the CCI is above zero. Meanwhile, if the CCI is below zero, the trend is down. The further it is from zero, the stronger the trend will be. In the following graphic we can see an example of this usage.

Trend signals seem, in principle, reliable signals, with the problem that in sideways periods we can detect many false signals.
Commodity Channel Index (CCI) Divergences
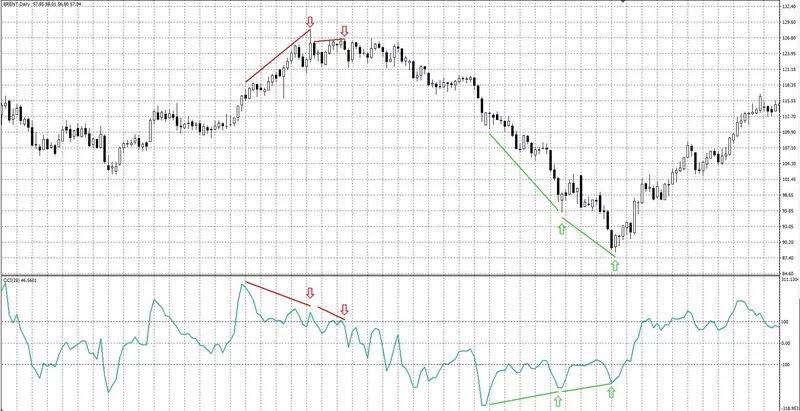
Finally, CCI divergences can give valid buy or sell signals. This, always taking into account, yes, the difficulty of operating divergences. In this sense, it will be considered that there is a bearish divergence when there are new highs of the price and that they are not accompanied by new highs of the indicator. Similarly, there is upward divergence when there are new lows in the price and there are no new lows in the indicator.

Commodity Channel Index (CCI) Usage Tips
Since this is just an oscillator, it should not be used during strong trends. At such moments, the indicator can confuse beginners.
Only the pros will be able to more or less understand the situation on the market.
But for a flat horizontal state, it will be ideal!
Advantages of Commodity Channel Index (CCI)
- The Commodity Channel Index is a useful technical indicator for determining when an asset may be overbought or oversold.
- It can also be used to identify bullish and bearish divergences in order to predict when a trend might run out of steam and expect a reversal .
Disadvantages of Commodity Channel Index (CCI)
However, CCI, like all technical indicators, is not without flaws. While it is primarily used to identify overbought and oversold conditions, the indicator is not pegged, meaning there are no minimum or maximum values. Thus, historical overbought and oversold values are even less predictive of future performance than some other indicators.
Another problem with CCI is that it is a lagging indicator. Like all such indicators, it is relatively poor at pinpointing exact tops or bottoms, as it tends to be more reactionary than proactive. Thus, it is better to time long or short entries on corrections or bounces, as the trend has usually already begun.
Useful Exteral Links
Conclusion
The lagging nature of the Commodity Channel Index makes it vulnerable to quick reversals - when the indicator gives a signal but the price does not complete the move in the direction of the expected move. This results in a losing trade. Because of this, CCI, like all technical indicators, is best used in conjunction with other technical indicators and a well-defined and prudent trading strategy.
Commodity Channel Index Tutorial, CCI Trading Strategy with Examples, CCI Formula