Bollinger Bands - Secrets, Tutorial, Examples
Introduction to Bollinger Bands
Bollinger bands is a tool for technical analysis of financial markets that reflects the current deviations in the price of a stock , product or currency.
The indicator is calculated based on the standard deviation of a simple moving average. Usually displayed on top of the price chart. The parameters for the calculation are the type of standard deviation (usually double) and the period of the moving average (depending on the preferences of the trader).
The indicator helps to assess how prices are located relative to a normal trading range. Bollinger Bands create a frame within which prices are considered normal. Bollinger Bands are built as an upper and lower border around the moving average, but the band width is not static, but proportional to the standard deviation from the moving average for the analyzed period of time.
A trading signal is considered when the price exits the trading range, either rising above the upper line or breaking through the lower line. If the price chart fluctuates between the lines, the indicator does not give trading signals.
What is Boolinger Bands?
Bollinger Bands ( sometimes a transcription of “Bollinger”) - can be defined as an indicator similar to moving average envelopes, but based on current market volatility . Unlike moving average envelopes, Bollinger bands change not only depending on the direction of the price movement, but also on the nature of this movement (price movement speed).
Bollinger Bands provide a statistical measure of how far a short-term move can go before it returns to the main trend.
Measure of volatility in Bollinger Bands is the standard deviation (RMS), which in Western literature is called the term standard deviation (Standard Deviation).
Bollinger Bands Formula
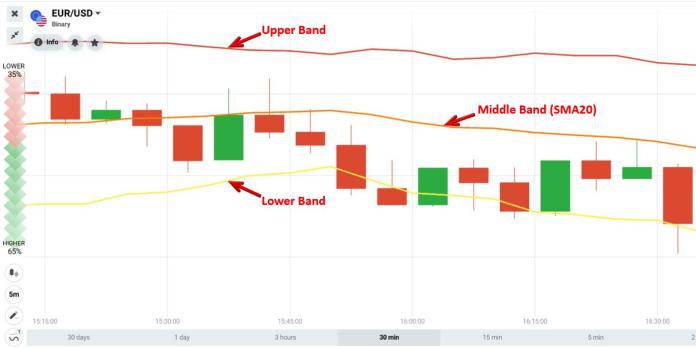
The indicator is superimposed directly on the chart and consists of three lines or bands:
center: simple moving average (MA)
top: upper band = SS + 2 standard deviations
bottom: bottom band = CC - 2 standard deviations
Standard deviation (STD) is a descriptive statistics term that measures the scatter or variance of a sample.
An illustrative example: there are two samples: 1, 3, 5 and 2, 3, 4. It is obvious that both samples will have the same arithmetic mean, i.e. 3. But the range, scatter, or variance of these samples is different: the first sample has 2, and the second has 1.
Calculating the standard deviation by hand is no fun.
Basically, you don't need a formula; as a rule, most of the forex trading softwares like MetaTrader have a built-in function for calculating the Bollinger Bands / standard deviation (in Excel this function is called STDEV ).
How Bollinger Bands are built
The most important issue for the correct construction of Bollinger Bands is the choice of the period of the moving average n . As a rule, a period of 20 is taken, but this is only a recommendation. Each case is unique and requires a special approach. To choose the right period for Bollinger Bands , you need to observe how the price will behave relative to the lower band with a double bottom : the second bottom should remain within the corridor. If the second bottom is out of the lower band, then the period is too short.
The standard deviation is calculated using the above formula. The sample in this case is formed from closing prices. The number of observations in the sample corresponds to the period of the moving average n.
Starting from the nth period on the chart, the calculation of the indicator starts; for each period is calculated:
- moving average
- standard deviation
- upper band
- bottom band.
How to use Bollinger Bands?
John Bollinger explains in his book Bollindger on Bollindger Bands that his indicator is not intended for continuous price movement analysis. It is impossible to look at the indicator at any time and draw a conclusion about the further behavior of the instrument. But at certain points in time, the indicator gives signals that, by themselves or in conjunction with other methods of analysis, allow you to use good trading opportunities with high profit potential.
The main components of the indicator are a simple moving average (middle line) with one line above and one line below, which is plotted at a certain distance from the moving average.
- The middle line, moving behind the chart, shows the direction of the trend.
- The upper and lower lines create a price range. If the chart goes beyond its boundaries, this is a signal to open a deal.
- If the chart and the lower line of the indicator intersect, then the trend may reverse in the very near future.
- If the candle on the chart crossed the lower border of the price range, it probably signals an uptrend.
- When the chart crosses the top of the Bollinger Band, it probably signals a downtrend.
Let us discuss above points with some examples:
Bollinger Bands and Uptrend
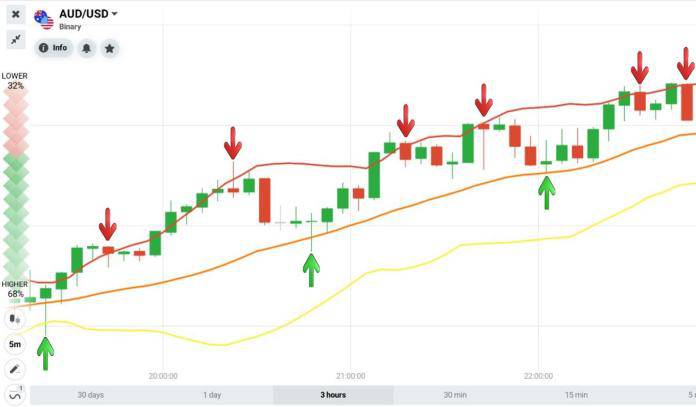
In an uptrend, the price will rise above the SMA20. At this time, when the price tends to touch the middle line (SMA20), it will go up. Moreover, when the price breaks out of the upper band, it tends to return to this band.
Bollinger Bands and Downtrend
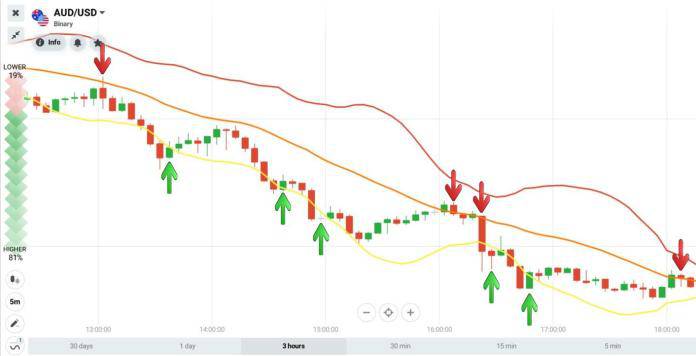
Conversely, in a downtrend, the price will fall below the SMA20. When the price tends to reach the middle line (SMA20), it will roll back. Moreover, when the price breaks the lower band, it tends to rise and return to this band.
Bollinger Bands and side trend
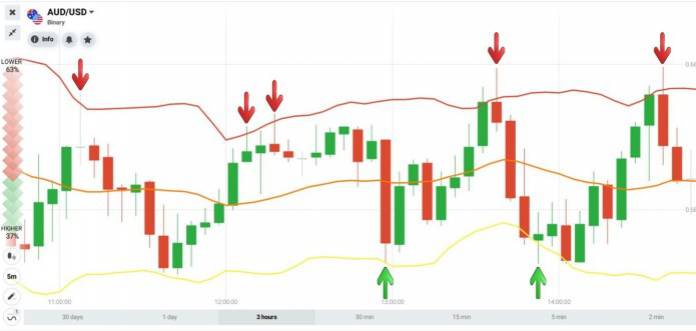
When the market is in a flat, the price will move within the upper and lower bands. In general, when the price tends to touch the upper band, it will pull back. On the other hand, when the price hits the lower band, it bounces back.
Bollinger Bands W-Bottom
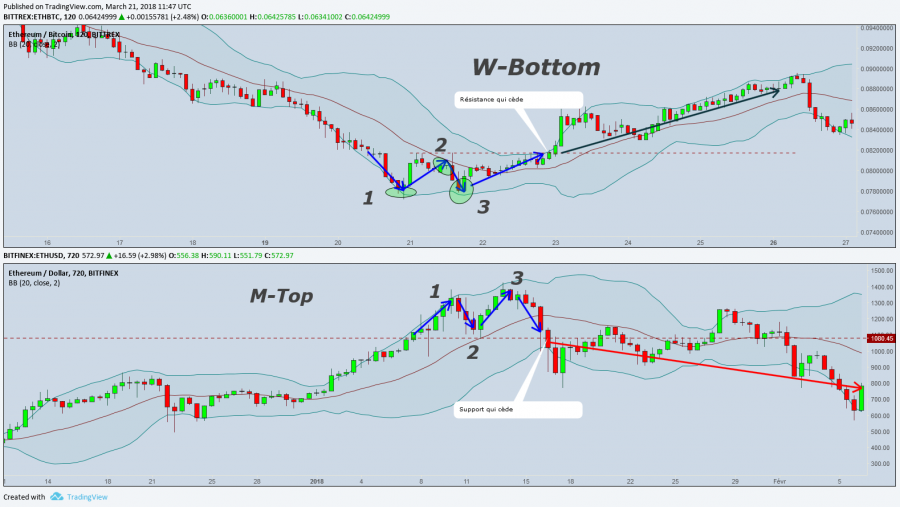
The W-Bottom is composed of 4 elements:
- A first low price will most of the time be below the lower band
- Another low must be found at the level of the intermediate curve
- The last rebound low must be above the lower band , this demonstrates a decline in willingness to sell.
- Finally, we must wait for this last bounce to pass the top of the W to enter the breakout
Bollinger Bands M-Top
The M-Top is based on the same principle but with the highs of the price and indicates a fall . It is more difficult to pin down, especially when the market is irrational because the first leg of the M will often be much larger than the second (this because of the phenomena of Panic Buy and FOMO . The buying force therefore runs out of steam very quickly on the first branch and the second is much less high.
Example of Bollinger Bands
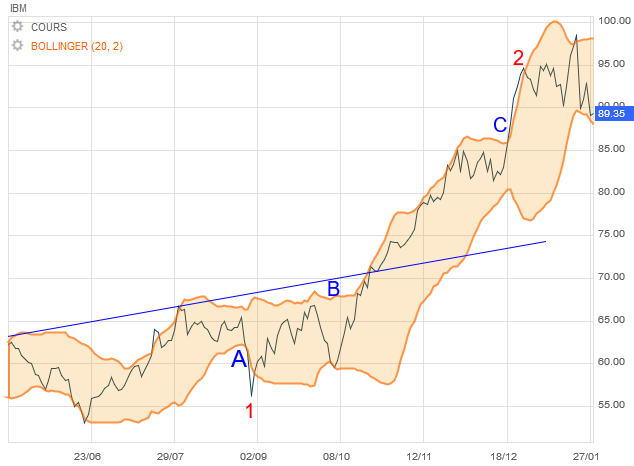
In the technical chart of IBM below, we see here that at the end of October, the gap between the two orange curves of the Bollinger was twice as large as at the end of September. And in fact, the 20-day volatility (period of calculation of the bands) was important at the end of October, when the value came out of its sleep.
What does the Bollinger tell us? How do we use it? Let's go step by step:
- Major price changes tend to occur after the bands tighten . We can see that the orange curves tighten at points A, B and C, warning that a change was about to occur. None missed! However, it remains difficult to know when exactly because the bands can still tighten more! But the beginning of the following gap can be trusted because it indicates the time of the expected change.
- Be careful though: prices have a tendency not to go in the right direction when coming out of a bottleneck in the bands. But they quickly come back to prove the forecast right.
- When prices break out of a band quite sharply, a continuation of the trend ensues. For example, when the prices leave the band at point C to follow it outside , it means that this rise is confirmed. In fact, the two sessions that followed continue the almost vertical rise.
- At point 1 in the pattern, prices make a small low outside the lower Bollinger then a small high inside this time. This characteristic is very powerful to signal the start of the rise.
- The reverse is also true. Point 2 shows the reverse pattern which this time signals a decline. There is also an increase on the outside, then a drop, the reaction of which is on the inside. In this case, the fall is not significant simply because the trend of the value is generally bullish.
- Finally, a price movement that originates on one edge of the band always tends to go to the other edge of the other band. It was the case in 1. And almost completely in 2: the strong bullish trend prevented the end of this prediction. This is useful for guessing the price movement to expect. So in 1, we reached the edge of the band opposite in 8 sessions without this edge having really had time to change level. We knew then how much we were going to win!
Bollinger Bands indicator with RSI indicator
Trading Guide:
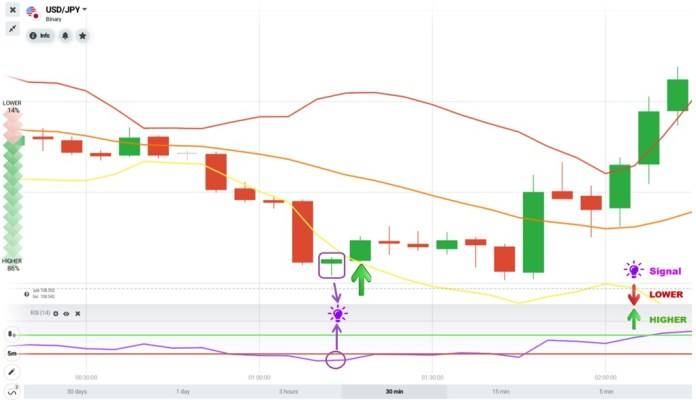
Opening a HIGH option = Price touches or breaks the lower band + RSI is in the oversold zone.
Explanation: When the RSI is in the oversold zone, the price tends to reverse. Concatenate the signal that the price touches or breaks the lower band ⇒ Open UP.
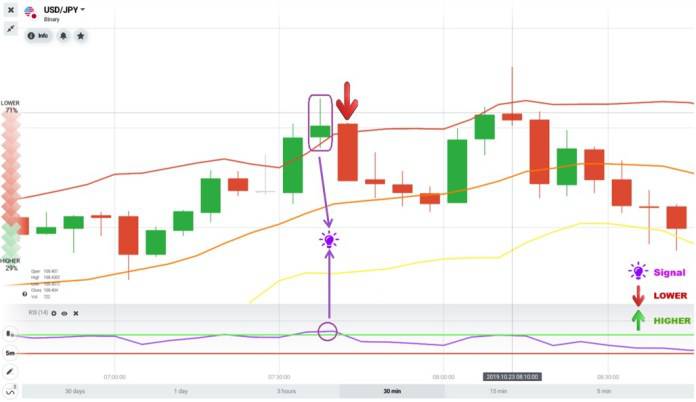
Open the LOWER option = price touches or breaks the upper band + RSI is in the overbought zone.
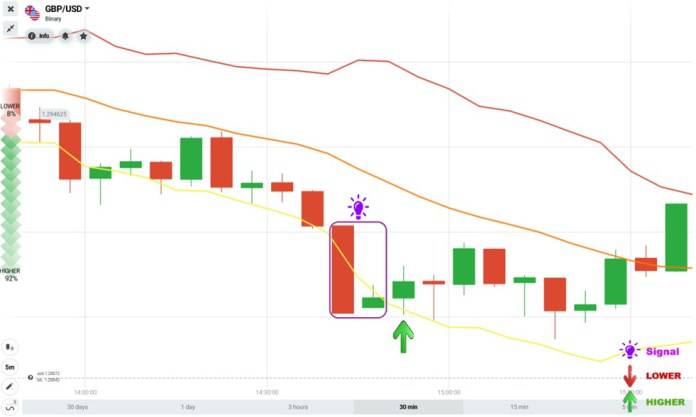
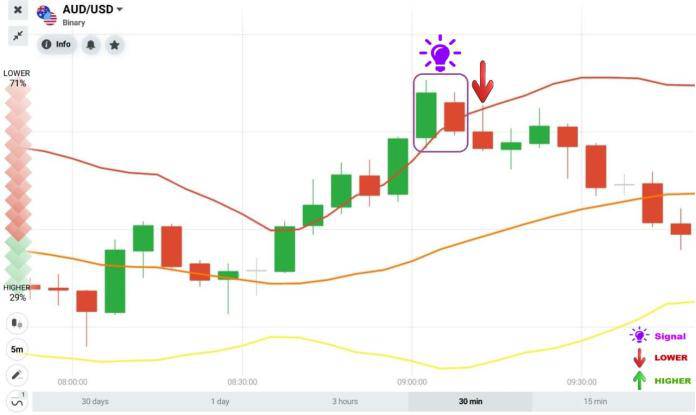
Bollinger Bands with Harami Reversal Candlestick Pattern
Trading Guide:
First , open a HIGHER option = price touches or breaks the lower band. The trading signal is a bullish Harami candlestick pattern.
Second, open the LOWER option = price touches or breaks the upper band. The trading signal is a bearish harami candlestick pattern.
Tips to consider when trading with Bollinger Bands:
- Put the definition of high and low volatility into perspective;
- It is not necessary to supplement a chart analysis with Bollinger with volatility or trend indicators;
- Prices that break above or below the channel are valuable information;
- Candles that end outside the upper or lower line are continuity signals;
- The central moving average is to be considered as a medium/long term trend indicator;
- Bollinger bands are a very versatile technical indicator and can be adapted to all markets: forex, CFD shares, commodity indices. European professionals can even use Binary Options Bollinger Bands, to reduce the level of risk.
Should Bollinger Bands be used?
Bollinger Bands are a classic in technical and chart analysis. It is an easy to understand and relatively intuitive indicator to set up, making it a tool of choice for most novice traders.
However, you should also know that this type of indicator is not perfect. The trend reversal when prices touch/exceed the high and low bands is indeed not systematic. If the current trend is strong, then prices may remain in overbought/oversold territory and continue to rise/fall. It is therefore important to wait for the confirmation of a signal and to use several trading tools and indicators ( MACD , RSI indicator , Ichimoku , etc.)
Advantages of Bollinger Bands
- Bollinger Bands are relatively simple to understand and use.
- Traders can spot the main trend at a glance based on where prices are relative to the moving average.
- The indicator makes it possible to quickly identify extreme price zones, namely when prices touch the extreme limits or even move beyond them.
- Bollinger Bands offer insight into the intensity of an asset's volatility.
- It is also an indicator that can identify support and resistance levels.
Disadvantages of Bollinger Bands
- One of the biggest limitations of Bollinger Bands is that it is a reactive indicator and not a predictive one. Bollinger bands are indeed one of the lagging indicators. The bands react according to the changes in the moving average, itself following the evolution of the prices.
- This indicator may provide false signals. Although an exit from the Bollinger bands generally represents an extreme situation, it does not necessarily lead to a trend reversal.
- The author of the method himself points to the possible inapplicability of the bands in illiquid markets and markets with low activity.
Bollinger on Bollinger Bands: The Book
John Bollinger is at the origin of the technical indicator, its relevance to market analysis and its practical applications to optimize risk management by taking advantage of variations in volatility.
He gathered all of his thoughts in a book: The Bollinger Bands. This book is the essential bible for all traders who wish to deepen their mastery of this technical indicator. All the strategies and theoretical explanations delivered in the various media (Internet in particular) are based on the work of John Bollinger.
Many online training courses include the book in digital format in their media via Bollinger Bands pdf with selected extracts that illustrate the themes addressed.
This book is a complete guide to investing using every possible way, and in every possible situation, the Bollinger Bands indicator. Some experts even argue that it is perhaps the most reliable and relevant tool for anticipating the evolution of an asset's price.
Conclusion
Bollinger Bands is a very useful technical indicator that allows you to easily identify periods when the price of a financial instrument is below or above its fair value . Bollinger bands use volatility, standard deviation and moving averages, which makes them not very convenient for self-calculation without technique. Every technical analyst should have John Bollinger Bands in service