Bollinger Bands and Keltner Channels Strategy
The Bollinger Bands and Keltner Channels Strategy For MT4 is one of the oldest trading systems designed. The fact that this trading system has stood the test of time speaks volumes. Since this system mainly only uses Bollinger Bands and Keltner Channels, it is a great way to trade market trends.
Bollinger bands and Keltner chanters are essentially channel indicators. The Bollinger Band works on the standard deviation and volatility of the price over the last 20 bars. The standard deviation is set to two. Meanwhile, the Keltner channel also operates on the standard deviation, but is determined by the mean true range.
So, these two indicators combined can give a unique view of the markets and how volatility can help you identify trends and take advantage of market patterns. In this version of Bollinger bands and keltner channel system there is an additional indicator which is the MACD
The MACD indicator can be used as a trigger to know when to go long or short.
Therefore, with only three indicators in play and those giving a lot of information to the trader, this trading system is very simple to use and understand. You can use Bollinger bands and the keltner channel both short term and long term.
Bollinger Bands and Keltner Channel - Long Positions

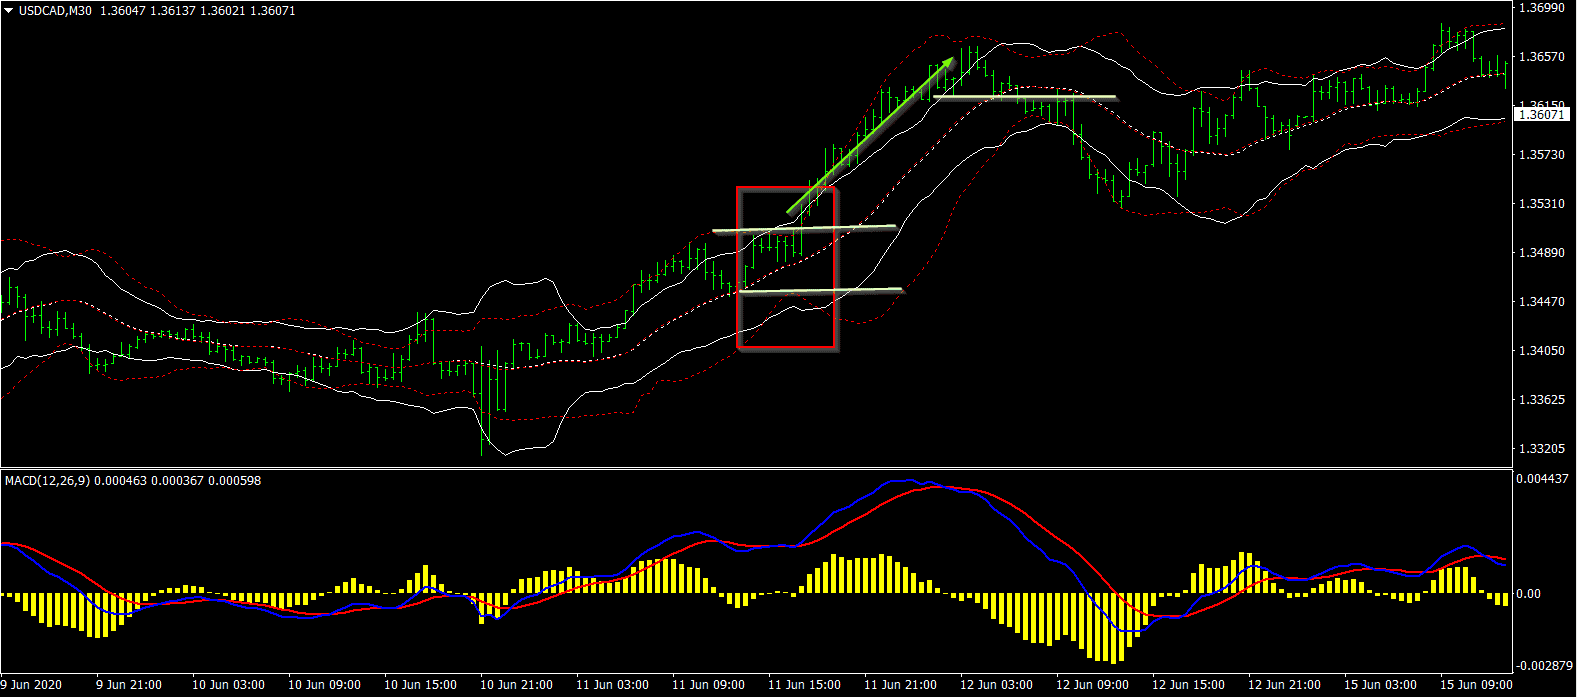
Once the indicators are loaded, you will see the chart configured as above. On the price chart, the Bollinger Band in red and the Keltner Channel in white. In the sub-window we have the MACD oscillator. These are quite simple in configuration.
To go long, we need to see the Bollinger Band slipping inside the Keltner Channel. This suggests that the volatility is very low. However, this setup still works because right after this squeeze, you will see a breakout trade occur.
Once you have identified the compression, the next step is to look for the MACD to point to a bullish signal. This is when the blue line intersects the red line. When this happens, look for the price to form a recent high. Set your entry at this level and your stops at the lowest low on the left side of the chart.
Now just wait for the breakout to happen. If your trade setup is correct, you will see a strong uptrend. Let the price play for a while. Ideally, your Bollinger Bands and Keltner Channels should also start to tilt upwards. This will ensure that the trend is really strong and also increases the chances of your trade playing out in your favor.
Make sure to book profits at regular intervals. Alternatively, when you see the Bollinger Bands starting to contract, it's time to book your profits. It should be noted that when it comes to setting up profits, there are different ways to go about it. Therefore, it is recommended to experiment with this method until you find something that works best for you.
Bollinger Bands and Keltner Channel System - Short Positions
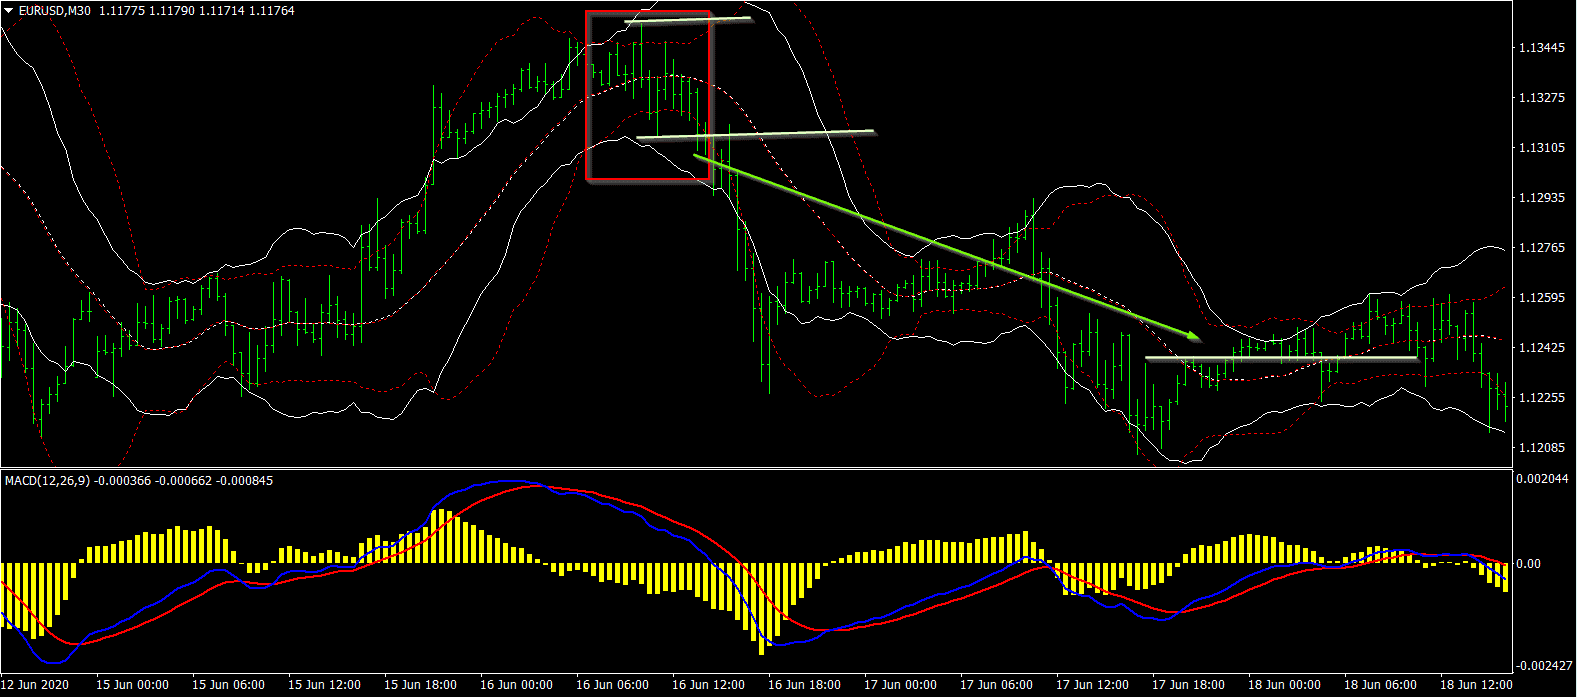
Setting up short positions on the Bollinger bands and keltner channel system is relatively simple. As mentioned in the long position, we need to look for the Bollinger bands to squeeze inside the Keltner channel. Assuming the previous trend was up and the markets are trading now, we next look to the MACD indicator for the sell signal.

In the pattern above, we can see that in the previous trend, it was up. Then, after the price peaked, it started to stabilize. At the same time, we see that the Bollinger Band is contracting and the compression is happening inside the Keltner channel.
The MACD indicator also signals a bearish movement. Note that this happens even before the Bollinger Bands begin to contract. Therefore, expect a certain level of subjectivity when trading with Bollinger bands and the keltner channel system.
Once all the conditions are met, identify the low that formed during its consolidation and set a short-term pending order. Immediately, look to the left side of your chart to identify the closest pivot and set your stop loss at that level.
If market conditions are good, you should see a breakout occur. Ideally, the price should escalate lower. It's often very fast. You must therefore be precise in managing your position. Set your profit level with a fixed risk/reward ratio or just follow the trend.
When you start to see the markets going flat, that's the indication to exit your position. You can also watch the MACD indicator and when it signals a bullish crossover, you can use it as a signal to exit your short position.
Are Bollinger bands and keltner channel strategy good for trading?
There is no doubt that the Bollinger Bands and Keltner Channels Strategy For MT4is very easy to use. There are many online resources you can use to read about how these two indicators work. Primarily, Bollinger bands and the keltner channel system are used for swing trading. But this system can also be adapted to trade on shorter timeframes.
While the Bollinger Band and the Keltner Channel are the main set of indicators that determine when to go long or short, the MACD indicator acts as a trigger. Therefore, you don't have to think too much when it comes to trading with this system.
Many traders believe that the more indicators, the better the trading system will be. But this is not true. With enough practice, you will see that Bollinger Bands and the Keltner Channel can be very effective for trading. Use the Bollinger Bands and Keltner Channels strategy on major currency pairs. You can also use it on other instruments such as gold or even crude oil.
Bollinger Bands and Keltner Channels Strategy explained here with chart examples