Chaikin Money Flow Trading Strategy: Day Trading Tips
Chaikin Money Flow, developed by Mark Chaikin, is a technical indicator that determines if a chart is in the process of accumulation or distribution. The Chaikin indicator compares the closing price with the high-low range of the trading session.
- if the price of the instrument closes near the high of the session with increased volume, the Chaikin indicator increases in price
- if the price of the instrument closes near the low of the session with increased volume, the Chaikin indicator decreases in value.
The Chaikin indicator measures buying and selling pressure over a period of time.
CMF is a popular indicator among traders who use volume technical analysis. Along with the balance volume, the Chaikin indicator tracks cash flow.
The Chaikin Cash Flow Indicator does not calculate cumulative total cash flow. Instead, the CMF summarizes the volume of cash flow for a given trading period.
How to Calculate Chaikin Cash Flow
The Chaikin Money Flow Indicator is calculated by adding up the accumulation/distribution line for a given trading period.
The formula for calculating CMF is quite complex. Let's try to simplify the formula and divide it into three simple steps:
1. We calculate the cash flow multiplier for each period
Cash Flow Multiplier = (( Close - Low ) - ( High - Close ) ) / (High - Low)
2. We calculate the cash flow volume by multiplying the cash flow multiplier by the volume of the period Cash flow volume = (Cash flow multiplier) x Volume
3. We calculate the Chaikin indicator by dividing the specified amount of the period of cash flow by the specified amount of the period of the period Chaikin indicator = (Set period amount of cash flow volume) / (Set amount of period volume)
Chaikin Money Flow How to get better settings
Traders usually use 20 or 21 periods to calculate the Chaikin money flow indicator.
Some use Chaikin's 50-Period Cash Flow to determine long-term accumulation/distribution.
- Chaikin money flow settings with values over 30 make the indicator less sensitive. This will result in less but better signal quality.
- Chaikin indicator settings with values below 20 make the indicator super sensitive. This will lead to increased market noise. Lower values of the Chaikin indicator should be carefully checked, as this can lead to many false signals.
How to read Chaikin's cash flow
Chaikin's cash flow confirms the market trend
The Chaikin indicator is used by traders to confirm the trend of the market. CMF values above zero indicate an uptrend, while CMF values below zero suggest a downtrend.
- when the Chaikin indicator is above 0, it is a bullish signal
- when the Chaikin indicator is below the 0 level, it is a bearish signal
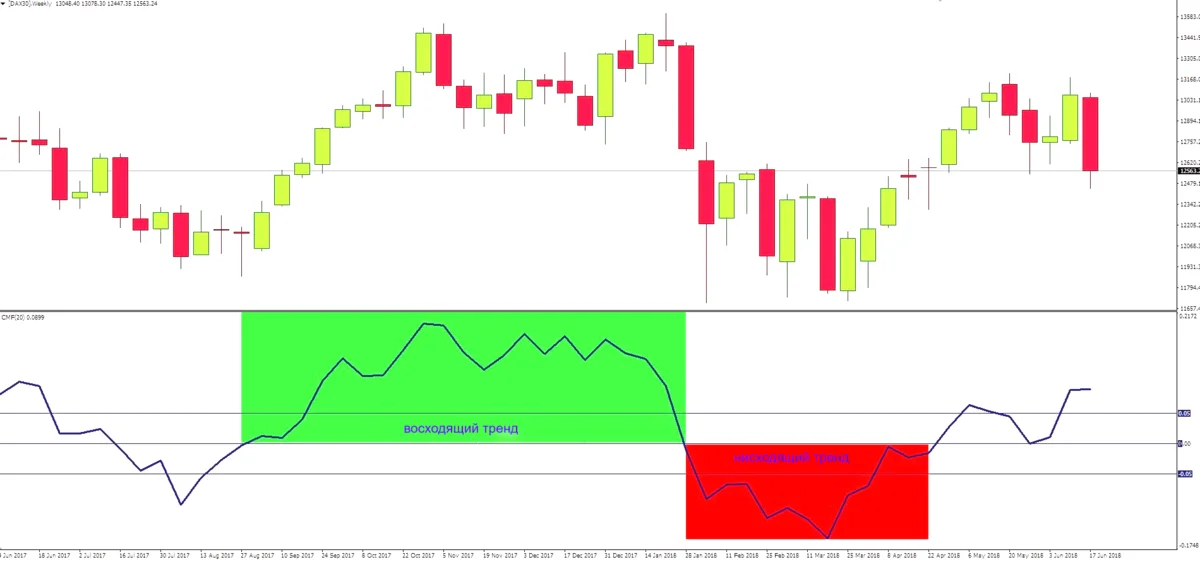
The Chaikin indicator is usually between -0.5 and 0.5 levels.
The Chaikin Money Flow Indicator rarely hits its highs/lows of -1 and 1.
Let's say we are trading with the 21-period Chaikin Money Flow Oscillator. To reach extreme levels of Chaikin money flow, it would take 21 consecutive periods at the high for the 21-period Chaikin money flow to reach +1 and the opposite to -1.
Moving the Chaikin Money Flow Oscillator from negative to positive or vice versa does not imply a change in trend.
In choppy markets , CMF generates many false signals.
For this reason, CMF should be traded in conjunction with other indicators.
Chaikin money flow confirms the strength of the trend
Chaikin money flow is also used by traders to confirm the strength of an uptrend or downtrend.
In this respect, the indicator resembles the Average Directional Movement (ADX), which also measures the strength of a trend.
Chaikin money flow confirms breakout of support and resistance levels
Chaikin money flow is used by traders to confirm a breakout of support or resistance.
- If there is a breakout of resistance during an uptrend when the CMF reaches new highs, this suggests that the bulls are taking control of the market. This is a signal to continue the uptrend
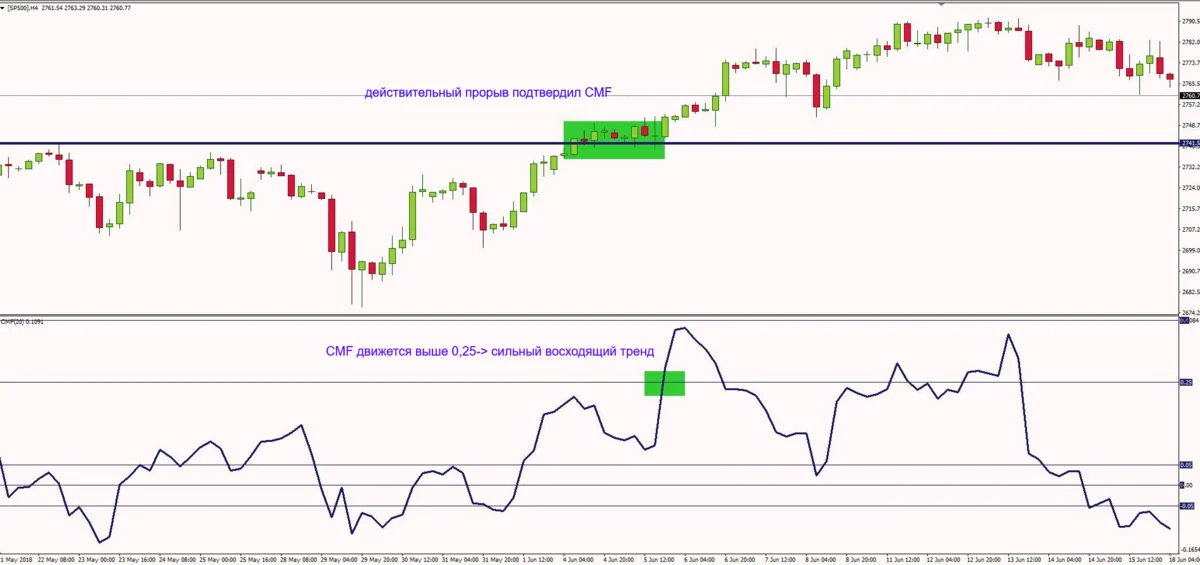
- If during a downtrend there is a break of support when the CMF makes new lows, this suggests that the bears are taking over the market. This is a signal to continue the downtrend.
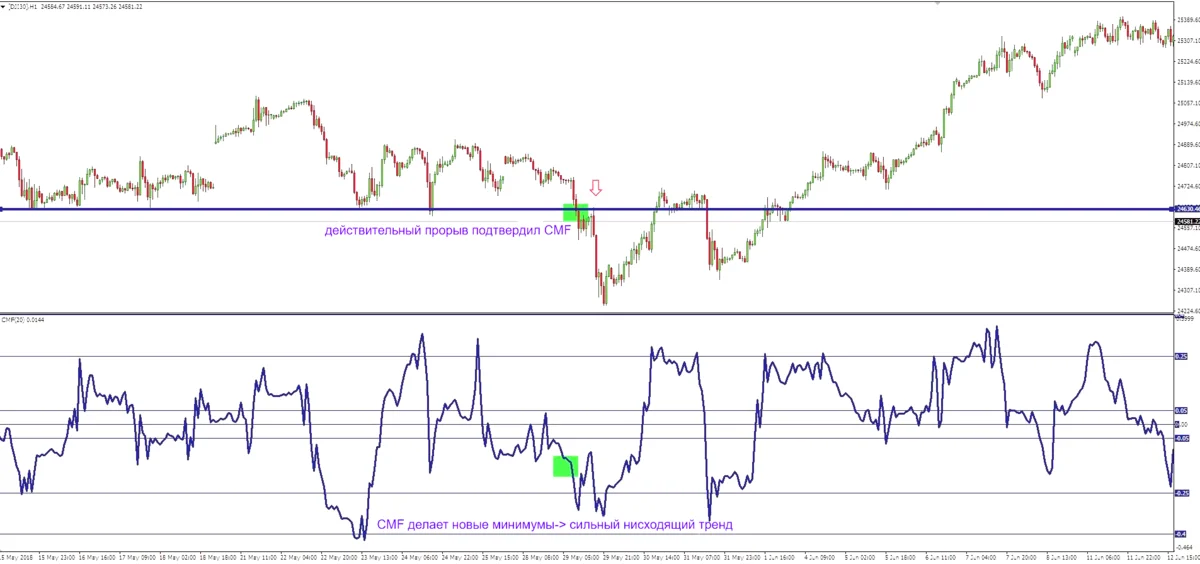
However, the Chaikin indicator has a drawback. CMF doesn't handle spaces very well. For example, if a gap occurs at the top and closes at a lower price, the cash flow will give you a negative figure despite the bullish rise in prices.
How to Read Market Conditions with Chaikin Cash Flow
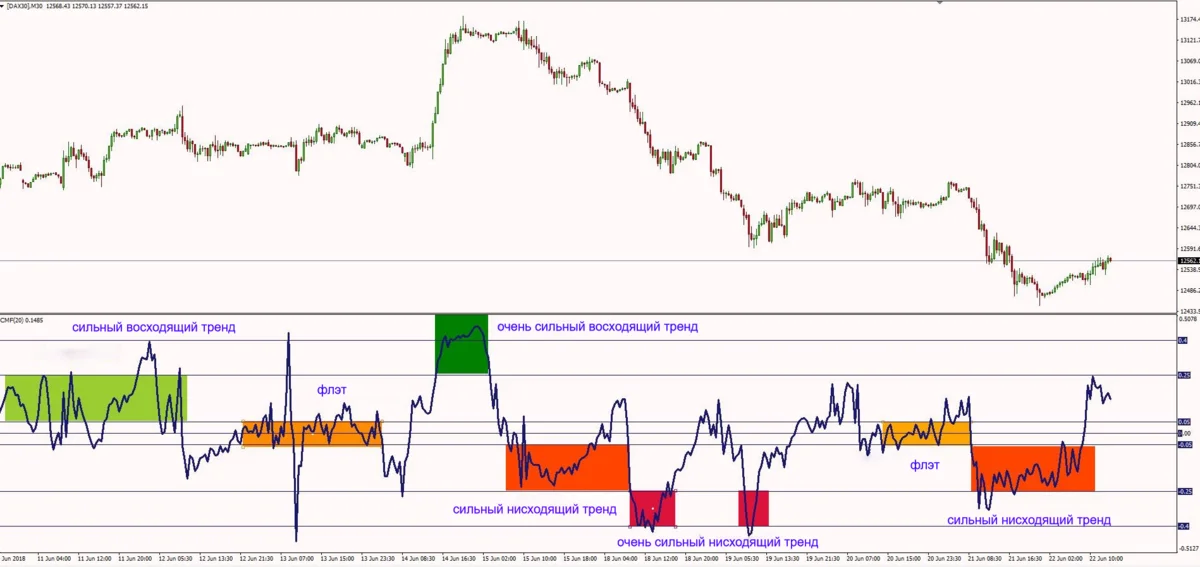
- Chaikin indicator values ranging from 0.05 to 0.25 indicate buying pressure on the bulls. This is a sign of accumulation and that the market is trading in an uptrend.
- Chaikin indicator values ranging from 0.25 to 0.4 indicate that the bulls are in control of the market. This indicates that the market is in a strong uptrend.
- Chaikin indicator values ranging from 0.4 to 1 indicate that the bulls are in complete control of the market. This suggests that the market is in a very strong uptrend.
- Chaikin indicator readings between -0.05 - -0.25 indicate bearish selling pressure. This is a sign of distribution and the market is trading in a downtrend.
- Chaikin indicator values ranging from -0.25 to -0.4 indicate that the bears are in control of the market. This indicates that the market is in a strong downtrend.
- Chaikin indicator values ranging from -0.4 to -1 indicate that the bears are in full control of the market. This indicates that the market is in a very strong downtrend.
- The indicator to Chaikin in the range from -0.05 to 0.05 means the decision period. When CMF trades between these levels, bulls and bears apply pressure to take control of the market. This area is often marked by volatility and is best avoided.
How to Trade with Chaikin Money Flow - Trading Strategies
One of the most common ways traders use the Chaikin indicator is to take signals when the oscillator crosses the zero level.
- when the Chaikin indicator crosses zero, a buy signal is formed
- when the Chaikin indicator crosses below zero, a sell signal is generated
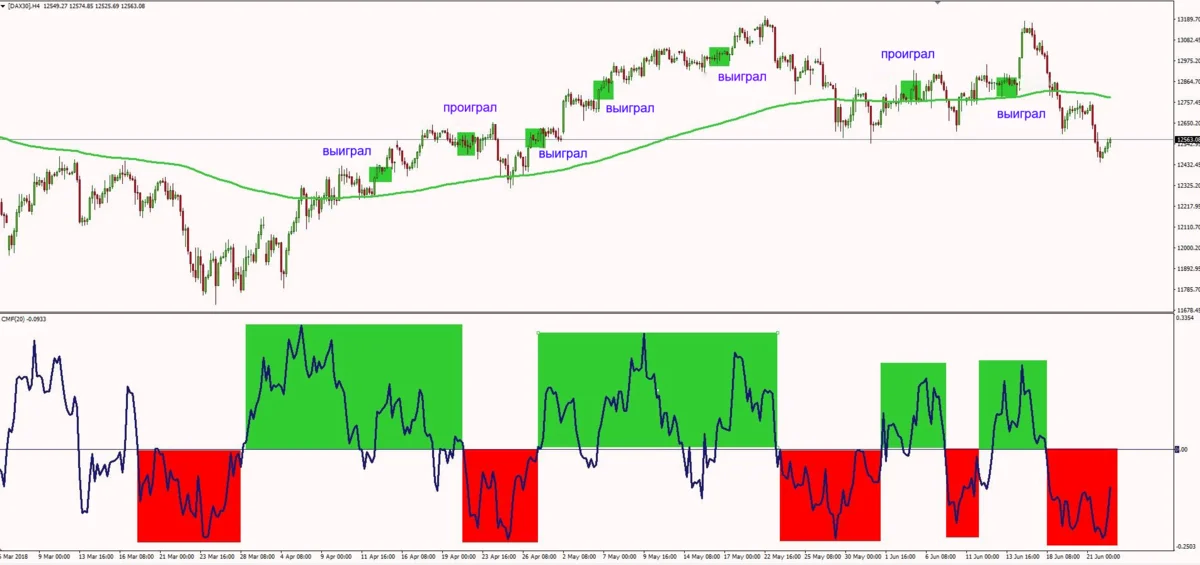
If we analyze the DAX30 cmf chart above, we can observe some decent signals generated by the Chaikin indicator.
The indicator itself is not so reliable and will give a lot of false signals. It is better to confirm the trend with another indicator.
In this case, we used a 200 period moving average to determine the prevailing trend.
- When the price is trading above the 200-period exponential moving average, we consider a buy-only option.
- When the price is trading below the 200-period exponential moving average, we only consider selling.
As you can see, this setup generated 7 uptrend signals. 5 signals were successful and 2 of them were lost.
The way to market was simple. We expected the Chaikin indicator to cross the zero level above the 200-EMA for a buy.
PRO TIP : The smarter way to trade the Chaikin indicator is to plot the 0.05 and -0.05 levels. Thus, you filter the fluctuations around the 0 level.
- Open sell positions below -0.05
- Open buy positions above the level of 0.05
Chaikin Cash Flow Divergence Trading Strategy
The Chaikin indicator can also detect divergences. Divergence occurs when price action deviates from the evolution of the Chaikin Money Flow Oscillator.
This basically means that the market momentum is not reflected in the price. This could be an early indicator of a reversal.
Unfortunately, many traders trade divergences incorrectly. Most of them look for regular divergences and enter the market blindly.
How NOT to use Chaikin Money Flow
Here is how NOT to trade divergences with the Chaikin Oscillator.
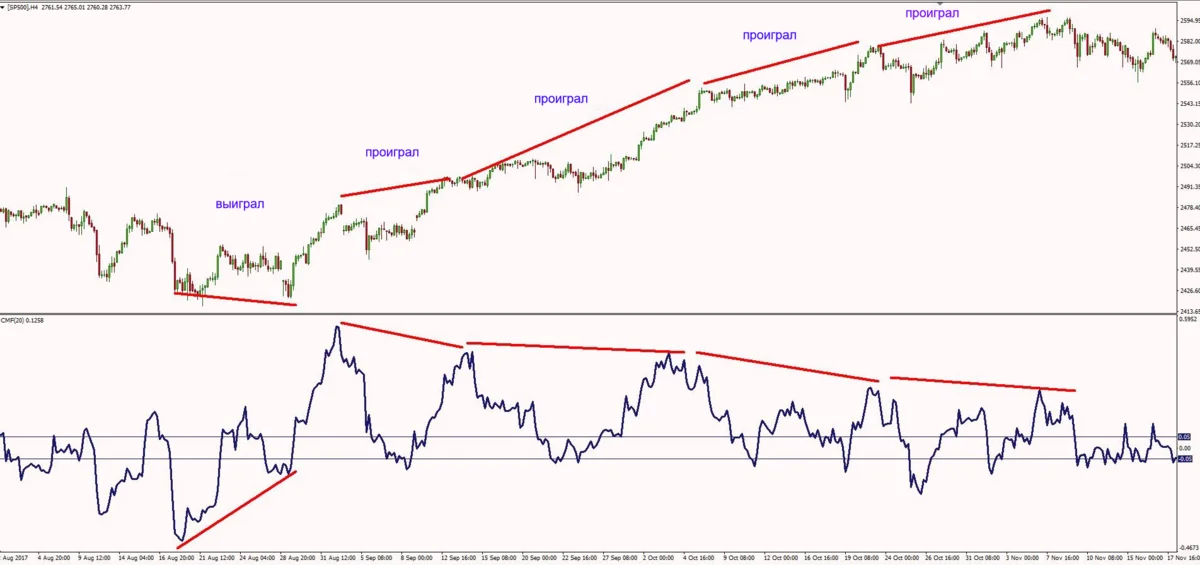
If we analyze the SP500 cmf chart above, you can see that we had 5 divergences between the price and the Chaikin indicator. Guess which ones: 4 of them failed.
During a strong trend, classic divergences do not work. This is why many traders use this technique incorrectly. And not only with CMF. This is also true for the Stochastic Oscillator, Momentum Indicator, Relative Strength Index, CCI, ROC or MFI.
So stop chasing discrepancies the old way. There is a smarter solution for trading divergences and I will show you how.
There is an elegant way to share discrepancies with CMF. This is what you should do is:
- We set the main trend by adding a 200-period exponential moving average - 200 EMA.
- When the price is trading above the 200-period exponential moving average, we only consider a buy option. When the price is trading below the 200-period exponential moving average, we only consider selling.
- Adding the Chaikin indicator, with the input of 20 periods
- We are looking for divergences between the Chaikin indicator and the price only in the direction of the main trend, indicated by the 200-period exponential moving average.
- If the price is trading above the 200 EMA, we are looking for divergences at the bottom of the Chaikin indicator, and if the price is trading below the 200 EMA, we are looking for divergences at the top of the Chaikin indicator
Let's look at the same graph, with a new setting.
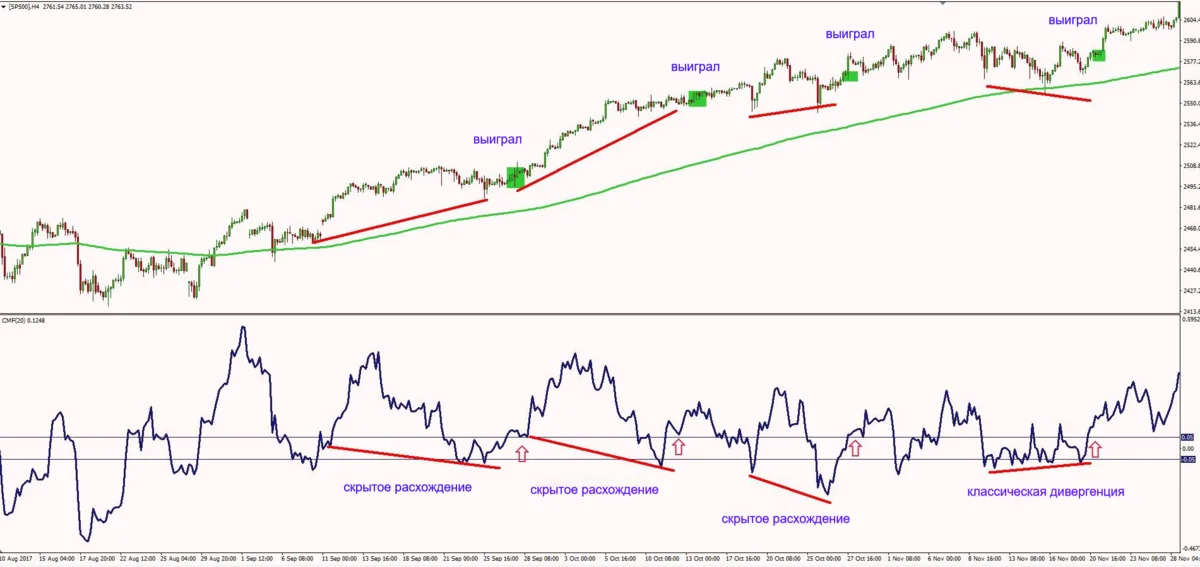
Here it is, the same CMF chart, but no more false signals.
By choosing only ascending divergences, we have greatly improved our style. This setup generated 4 signals and all trades were successful.
The secret lies in the hidden divergence. For some reason, hidden divergences are harder for many traders to spot despite being a high probability pattern.
As soon as we see a hidden divergence on the Chaikin indicator, we wait until the oscillator rises above the 0.05 level.
As soon as the indicator crosses the 0.05 level, we get confirmation that the bulls are in control of the market. Also, don't forget that we are trading in the right direction, with the main trend. It's pretty powerful.
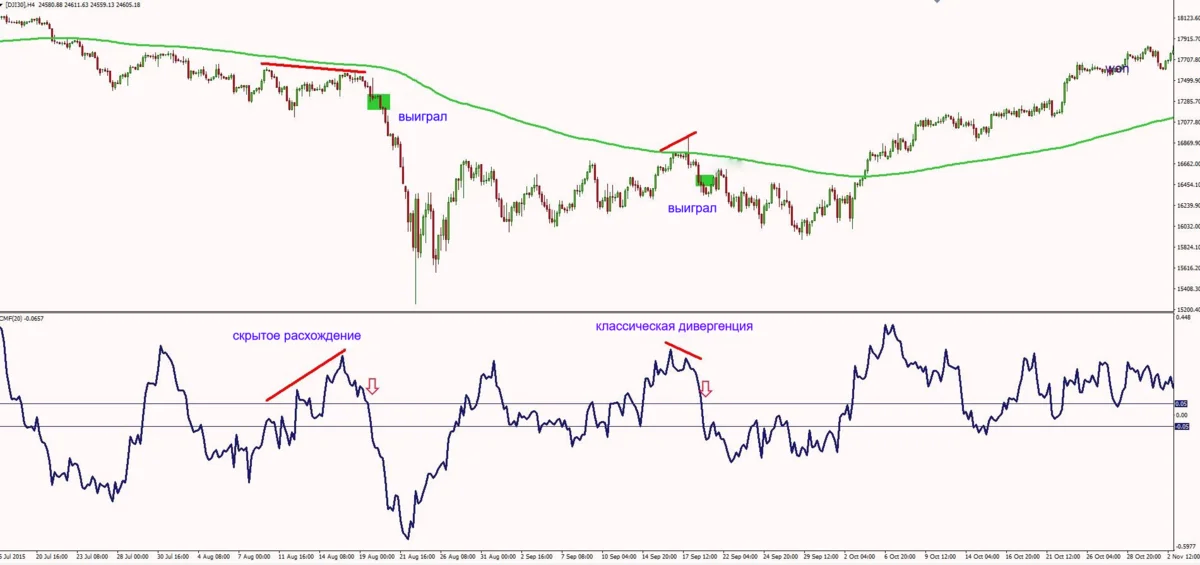
Let's analyze another chart, this time the Dow Jones. This time, we have established that we are in a downtrend as the price is trading below the 200 exponential moving average.
Using the same principles, the system generated 2 reliable signals. Both of them were successful transactions.
The first signal was a great sell signal after a hidden divergence. We entered the market when the Chaikin indicator crossed below the -0.05 level.
The second was a classic divergence. It was a high-probability setup because it happened near the 200 exponential moving average. The price rejected this area and we sold after the Chaikin Oscillator closed below the -0.05 level.
The main advantage of this system is the fact that we have 3 market forces when trading:
- long-term trend, indicated by the 200 EMA
- momentum offered by divergence
- trend strength indicated by Chaikin Money Flow
Using this approach, we will reduce market noise and eliminate false signals. We will have fewer, but high-quality signals.
Chaikin Money Flow - Moving Average Crossover Strategy
To smooth out the signals offered by the Chaikin money flow indicator, I prefer to add a moving average on the oscillator.
By adding a moving average to the Chaikin indicator chart window, I am taking cross signals to get higher quality signals.
When the markets are trading in a range, this system is subject to double swings, which will result in losing trades.
A long-term moving average added to Chaikin's money flow will perform better than a short-term moving average. A long-term moving average will give fewer quick reversals.
Besides, it's not enough. This system will generate many false signals unless we confirm the trend with other indicators. We cannot accept an indicator's signal without knowing the market trend.
Therefore, I prefer to determine the prevailing trend in the market using the Ichimoku indicator. For this setup, I'm only building a Kumo cloud.
Let's look at some charts.

Let's look at the commodity market , at the gold chart.
We built a Kumo cloud and added a 200 period moving average to the Chaikin Money Flow indicator with a 50 period entry. We want to smooth the indicator. With this period, we will avoid failures.
The setup is simple:
- Only buy signals above the Kumo cloud when Chaikin money flow crosses the 200 period moving average
- Only sell signals below the Kumo cloud when Chaikin money flow crosses the 200 period moving average
The golden chart above generated 3 signals. First, a buy signal above the Kumo cloud and two sell signals below the cloud. As you can see, all transactions were successful.
Outcome
- We do not accept entries when the price is inside the Kumo cloud. If a crossover between Chaikin Money Flow and the 200 EMA occurs when the market price is inside the Kumo cloud, we ignore this situation.
- We can enter a trade when the price closes above or below the cloud in the direction indicated by the crossover. But never when the price is inside.
Advantages of using Chaikin cash flow
- An excellent indicator for identifying divergences on a chart
- Works well in trending market conditions
- Confirms well the direction of the main trend
- Perfectly confirms the strength of the main trend
Disadvantages of using Chaikin Cash Flow
- In a volatile market, many false signals are generated around the zero level.
- The CMF value is not accurate when there are large gaps in the market
- The Chaikin indicator does not contain all the data needed to properly analyze price action, so it should be used in conjunction with other tools
- When used at lower settings CMF can generate multiple turns if used incorrectly
- Unreliable on lower timeframes like M1, M5 or M15
- Lagging indicator as it follows the price
Chaiken Money Flow successful strategy with Ichimoku and Moving Aveage explained. Chaiken Cash Flow strategy tutorial with example