Relative Strength Index (RSI) Complete Tutorial with Pictures
Traders and analysts fall into two main groups. The former prefers fundamental analysis, the latter is fond of technical indicators. However, there is a third group. They combine fundamental and technical factors. However, everyone should know the crucial points of each type of analysis.
In this article, we will talk about one of the most important technical indicators – the RSI indicator.
What is RSI?
The Relative Strength Index, or Relative Strength Index, was created by J. Welles Wilder. Before becoming a technical analyst, he worked as a mechanical engineer. This fact helped him develop not only the RSI, but also other indicators, such as the Average Directional Index, the Average True Range, and the Parabolic SAR.
So if you were wondering what is RSI, here is the answer: it is a price oscillator. But before we go into more detail, let's explain what an oscillator is. If you open a trading platform, for example MetaTrader, and choose the indicators tab, you will see a list of indicators that will be grouped by their functions or creator name. So, you can see trend indicators, oscillators, volumes and also Bill Williams.
Oscillators are technical indicators that vary over time between two main points (key levels) and determine the conditions of the market, or the stock market.
In this sense, they show whether the market is overbought or oversold.
Ok, back to the RSI. We have mentioned that the relative strength index is an oscillator that shows price strength, counting the speed and magnitude of recent price changes and representing overbought and oversold market conditions.
RSI Indicator Definition
Originally developed and published by J. Welles Wilder in 1978. The RSI (Relative Strength Index) is an oscillator-type indicator that reflects the relative strength of upward movements, compared to downward movements. When framed within the oscillator type, its value will move in the interval [0.100] being represented by a continuous line within it.
If the concept still seems complicated to you, let's see some examples.
How Does the RSI Work and How to Read It?
As we mentioned earlier, there are different types of indicators. They differ with functions, names and location. For example, take a look at the chart below. Trend indicators are applied on the chart, while oscillators are in a window below the chart.
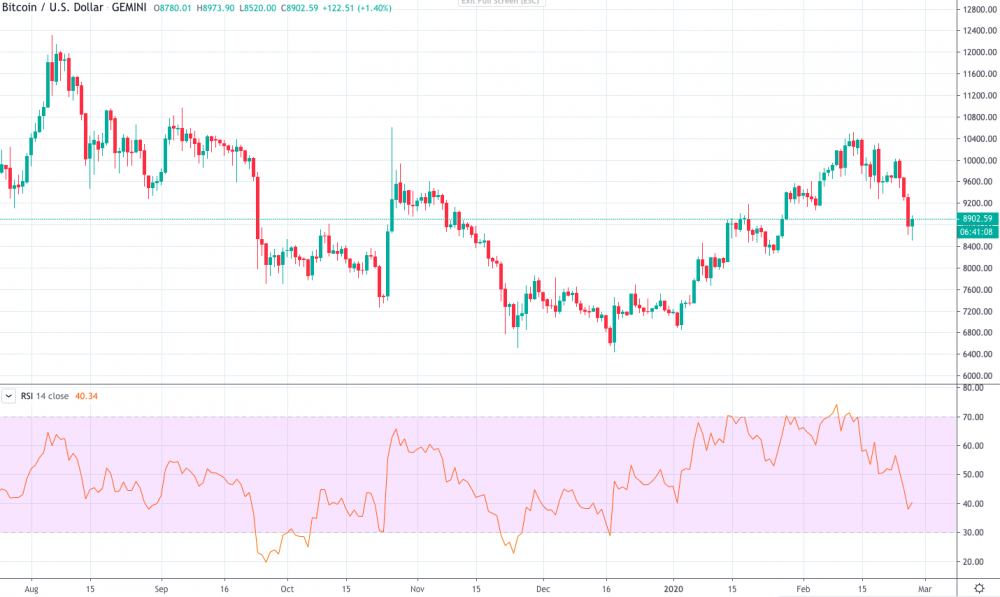
The same happens with the relative strength index. It is placed in a window below the price chart. As you can see, there is a line, the index, and two levels: 30 and 70. The rsi indicator shows the sentiment of the market.
RSI Indicator: Buy and Sell Signals
The first and main function of RSI is to determine the condition of the market. You need to look at the indicator. Level 30 is a border of the oversold area. A break below this level indicates that sellers (“bears”) prevail in the market. This situation means that the asset is oversold and traders can expect a market reversal.
Remember a crucial aspect of trading: the rise, or fall, of the asset cannot last forever, a reversal will take place soon. However, the indicator will give you a signal only if it crosses the 30-level ascendant. That will mean that the reversal is taking place. However, do not blindly believe in an indicator. Get a confirmation from a candlestick or from another indicator, for example, the MACD. As soon as you get more proof, you can go long.
The second crucial level of the rsi indicator is the 70 level. It is a vital point in the overbought area. If the indicator enters the area above the 70 level, it means that there are too many buyers (“bulls”) in the market, and the asset is overbought. Therefore, traders can expect a reversal to the downside. Again, the signal appears only if the index crosses the 70 line from top to bottom. Remember the confirmation. If you succeed, open a short or sell position.
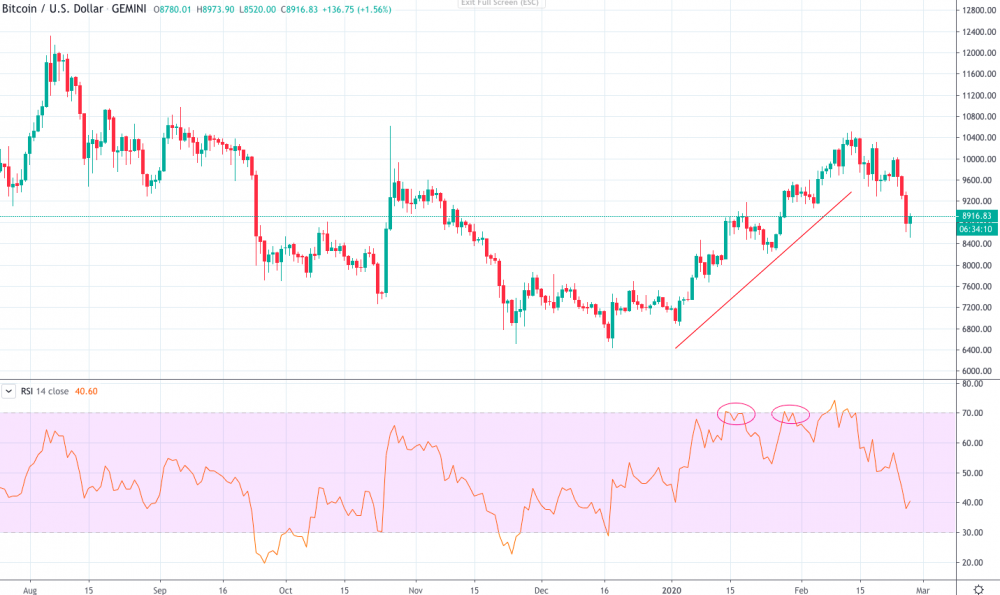
Note: Although the indicator gives a signal when the market is oversold or overbought, you should look at the situation as a whole. In times of strong trend, the indicator can stay in the oversold/overbought area for a long time. If you notice a strong downtrend, don't wait until the RSI crosses the 30 level from the bottom up. Sell until the indicator is in the oversold areas. The same rule applies to the overbought zone. Buy inside the strong uptrend.
We can find a good example in the crypto market, or crypto market.
On the daily chart of BTC/USD , you can see that the RSI indicator was in the overbought area several times. However, the direction of the pair did not change due to the strong uptrend. Also, if the indicator does not go far into the overbought or oversold area, the trend is more likely to continue.
Bullish and Bearish Divergence
Divergence is the function of the second indicator. Divergences give a stronger reversal signal than the 30/70 levels. All you need to do is find a difference between the direction of the price chart and the indicator.
When a new price high is not followed by a new Relative Strength Index high, it's called a bearish divergence, you get a signal to sell. That means the price will drop soon.
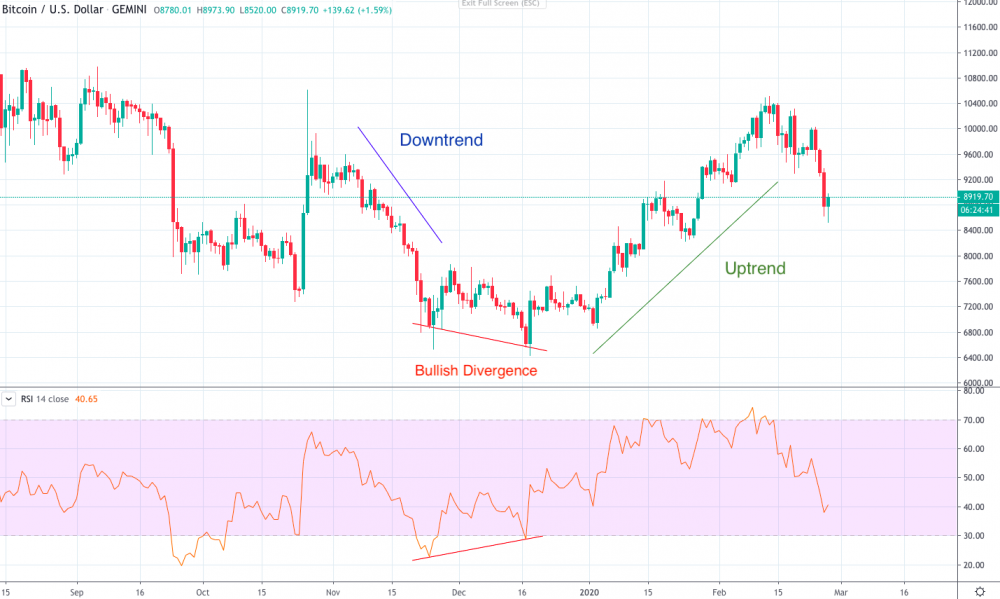
If the price forms a lower low while the index has a higher low than the previous one, it is a bullish divergence or a buy signal.
Bitcoin RSI Chart
On the daily chart of BTC/USD , we noticed a bullish divergence when the price formed a lower low while the RSI low was higher. It was a sign of the change in trend. Before the divergence, the price had been going down, forming a downtrend. After the divergence, we see a consolidation that was followed by the trend reversal.
=====
How to Calculate the RSI Indicator?
It is unlikely that you will need to calculate the rsi indicator to trade the stock market. It is easily implemented in MetaTrader (we will explain how later). However, if you still want to measure the index, we are ready to introduce the formula.
The calculation consists of two parts. The first reflects the initial value of the Relative Strength. Presents the relationship between the average UP close and the average Down close within the chosen period (period N).
RSI = 100 - (100 / 1 + RS)
Let's take the standard period setting of 14.
- *RS or Relative Strength is Average Gain divided by Average Loss.
- Average Profit = Sum of Profits in the last 14 periods / 14.
- Average Loss = Sum of Losses in the last 14 periods / 14.
Losses are counted as positive values.
The second step gives us the result:
RSI = 100 – (100 / (1 + [Previous Average Gain x 13 + Current Gain] / [Previous Average Loss x 13 + Current Loss])
How to Implement the RSI Indicator?
Now that you have learned the basics about this indicator, you may already want to apply it to your trading. Next, we will tell you the step-by-step instructions so that you can do it successfully. The truth is that it is quite simple and will not take much time.
- Go to MetaTrader , click Insert on the top panel and choose Indicators. You will see a list of the indicators we talked about earlier. You need oscillators. Click on the tab and select the RSI. Now, you need to configure the settings.
- A point is a number of previous bars that the indicator counts. 14 is a standard setting. You can set any period and check the strength of a signal.
- The second configuration is the price. It can be closed, open, high, low, etc. In this case, the standard closing price setup works the same as other setups.
- Other things you can do are change the color, line format, and place additional levels. 30 and 70 levels are basic. However, later you will see that some strategies require additional levels.
Relative Strength Index: Strengths and Weaknesses
The relative strength index is one of the easiest and most accurate indicators. However, we must consider that it not only has advantages, but also disadvantages.
Advantages of RSI Indicator
- Ease. Despite the drawbacks, the RSI indicator is still one of the easiest indicators. It is a standard indicator in MetaTrader. Therefore, you do not need to download or purchase it.
- Additionally, its signals are easy to read. There are only two areas (over 70 and under 30) and one line that moves within them.
- More accurate than others. There is no perfect indicator that will give a 100% correct signal to open a position. All indicators suffer from a time lag just because they count previous price movements.
- However, there are indicators with more signals and less precise ones. So, the Relative Strength Index is the one that gives strong signals.
Disadvantages of RSI Indicator
- Short-term signal: Regardless of the period of the rsi indicator and the timeframe of the asset you choose, the signal from it will take place over a short period.
- Also, the indicator can be in the oversold/overbought area for a long time, while the trends are strong. Thus, if you are waiting for the strong reversal of the trend, the RSI is not the best indicator to help you.
- Period errors. 14 is the default period. However, it is not the best setting for all time periods. If you trade short-term, this period will miss a lot of signals. Whereas if you trade long term, you may encounter false signals. Therefore, it is not easy to find the perfect period for your period of time.
- Remember that a larger period smooths out price fluctuations but gives fewer signals, while a smaller period gives more signals, but they may be false. We recommend you to use the standard period of 25 for long periods and the period 9 for short periods.
Useful Strategy for the Relative Strength Index
To avoid making unsubstantiated claims, here is a strategy that you can use to trade with the RSI indicator.
Entry:
- Currency pair – any
- Time frame – H4
- RSI – Period 8, apply to “Close”, levels: 30, 40, 50, 60, 70
Buy Signal
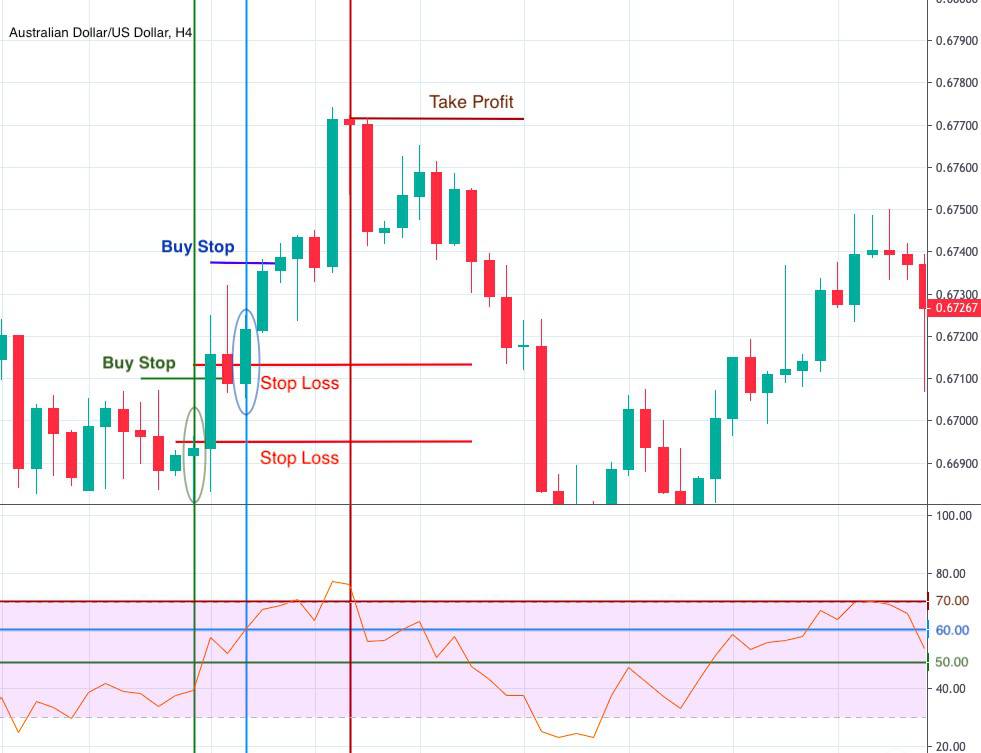
- Please note that we added more levels than usual. You can do it easily in the indicator settings. When the RSI crosses the 50 level bottom up, place a Buy Stop pending order 15 pips above the candlestick where the crossover occurred. Place the Stop Loss between 5 and 10 pips below the local minimum.
- When the RSI goes above the 60 level, place the second order. Stop Loss should be placed 5-10 pips below the local low.
- The signal to close the position will appear as soon as the RSI drops below the 70 level.
Sell signal
- When the RSI breaks the 60 level from top to bottom, place a pending Sell Stop order 15 pips below the candlestick where the crossover occurred. The Stop Loss must be between 5 and 10 pips above the local maximum.
- When the indicator breaks below the 50 level, place another pending order below the crossover candlestick. Remember the Stop Loss. It will also be above the local maximum.
- When the index breaks above the 30 level, close the position with your profit.
Successful Strategies of RSI
IDENTIFY PRICE TRENDS
The RSI is used to give trading signals and to identify moments of overbought or oversold of an asset. It is also possible to use it to identify the direction of prevailing trends in a market and to draw support or resistance lines for those trends.
To identify the direction of the predominant trend, it is first necessary to define the time range of the study: short, medium or long term. Once done, the guidelines to follow are as follows:
- If the RSI reading has always been above 30 in the defined range, the primary trend will be bullish.
- If in the defined range the RSI reading has always been below 70, the primary trend will be bearish.
Below are two examples of primary trend identification on the daily movement of the EUR/USD currency pair. In these examples, on the RSI chart the shaded area has been limited precisely between the values of 30 and 70.
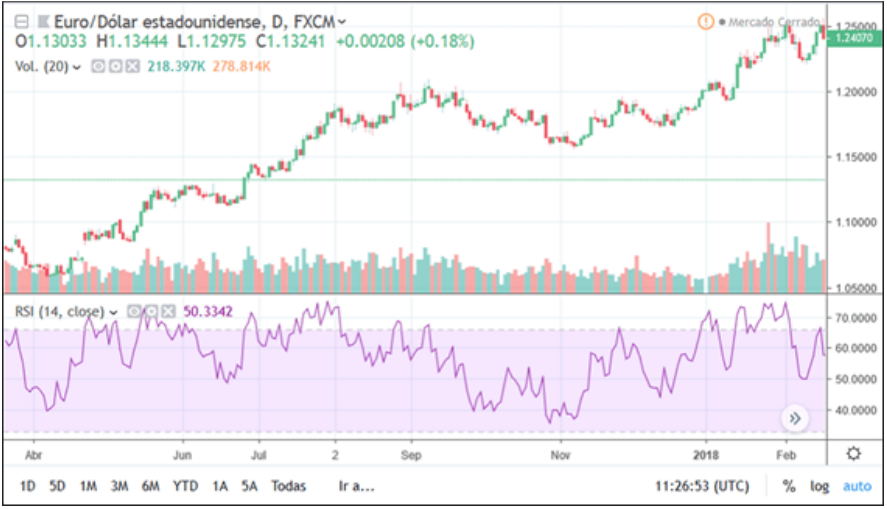
An example of an uptrend is shown on this chart. It is possible to observe that while the upward momentum of the price is maintained, at all times, the RSI reading is above 30.
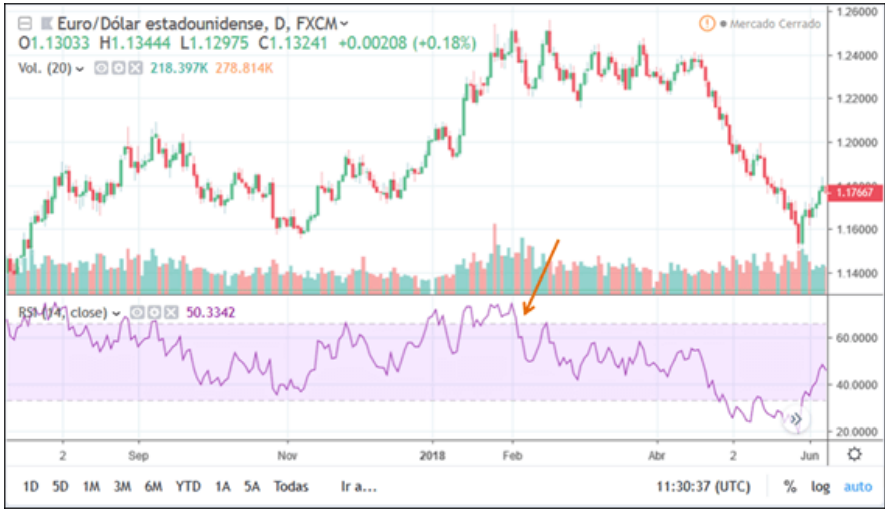
In this other image a change of situation is observed.
From the moment indicated on the chart with an orange arrow, it can be seen how the RSI reading does not exceed the key level of 70 again, mentioning that despite the fact that the movement of the EUR/USD is initially lateral, the primary trend in the background is bassist
The bearish trend is confirmed some time later with the downward break of the lateral channel in which the currencies have moved. During the period of lateral movement in the market, a trader should preferably opt for bearish orders in order to increase the chances of profit. You can see how the graph supports this decision.
TREND LINES ON THE RSI ITSELF
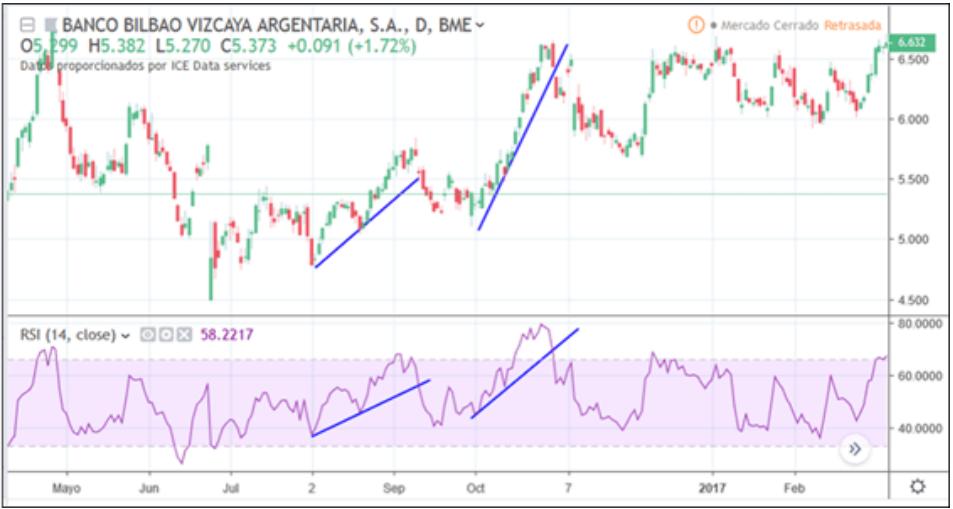
Apart from identifying the prevailing direction of a trend, the RSI reading chart also allows you to draw support and resistance lines. Breakouts of these lines can be used to confirm trend changes in price.
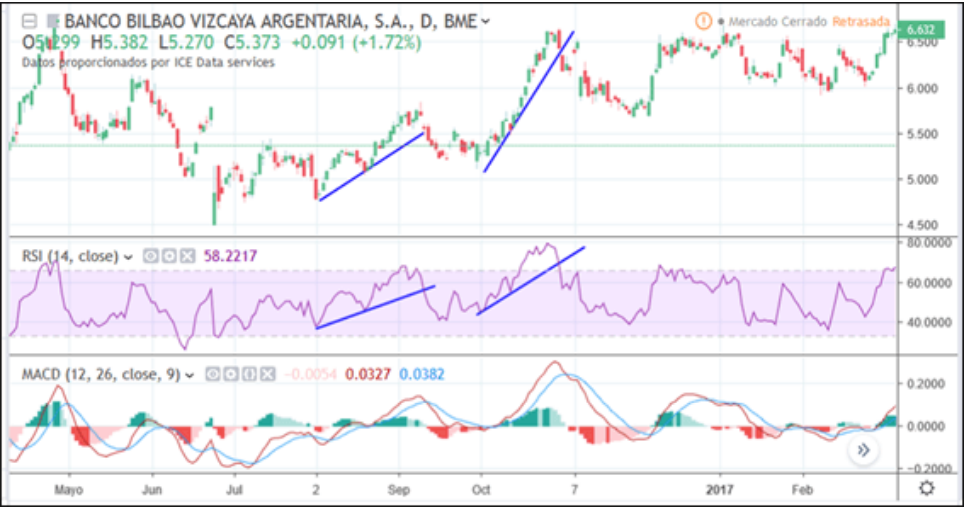
The following chart, drawn from the BBVA daily price chart, shows two examples of trend lines drawn on the RSI that allow confirming changes in the price movement.
Once the figure is observed, it is possible to identify downward turns in the price that allow confirming the closing of long positions in the event that they have been previously opened.
DIVERGENCES BETWEEN PRICE AND RSI
A divergence occurs when price action moves in one direction and the RSI does not follow that movement. Divergences are therefore divided into bullish and bearish:
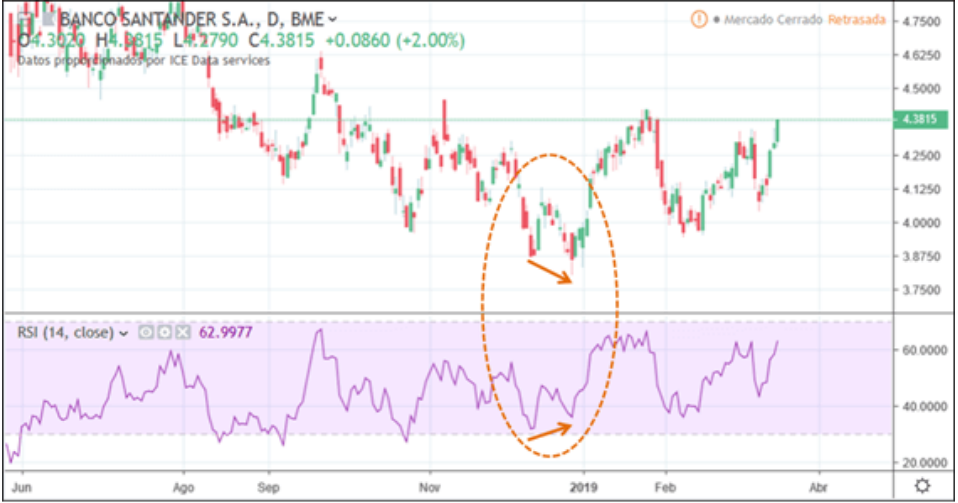
A bullish divergence is created when the RSI reading marks an oversold low followed by a higher low. In turn, the price marks lower minimums. This divergence indicates bullish momentum, thus providing a signal to open a long position on the asset being studied.
The following graph shows the daily price of shares of Banco Santander in which an example of an upward divergence of the RSI with respect to the price has been indicated. In this area, it can be seen how Santander's price marks increasing lows while the RSI reading indicates the opposite.
It is verified how after the divergence occurred, the price had an upward behavior.
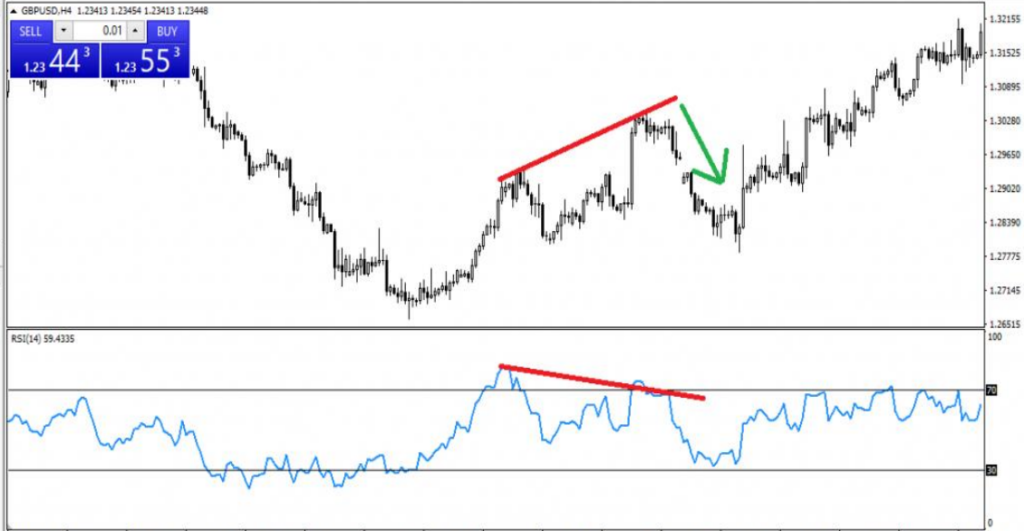
A bearish divergence occurs when the RSI reading marks an overbought high followed by a lower high. In turn, the price marks increasing maximums. This divergence signals the loss of bullish momentum and warns of the start of a downward price correction. Such a divergence on RSI provides a signal to open a short position on the asset under study.
The chart below shows the GBP/USD pair, indicating an example of bearish RSI divergence from price. It is verified that after the divergence occurred, the price had an upward behavior.
DOUBLE BACKGROUND IN RSI
It is a type of signal that indicates the beginning of an upward reaction in the price of an asset after a correction is caused in it. For this signal to occur, a series of particularities must appear:
- Strong uptrend for a significant period.
- Breakout of the trend and downward price correction which in turn causes the RSI reading to break the 30 level.
- Bullish bounce of the price from that level, during a small period of time.
- New downward price correction that again causes the RSI reading to break the 30 level.
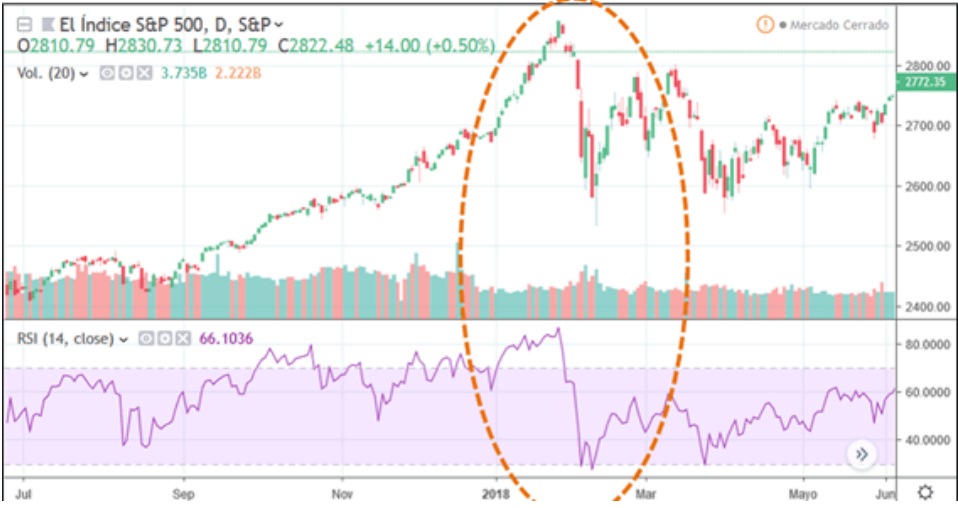
Once the double bottom in both price and RSI has been confirmed, a strong bullish price reaction is likely to take place within a short time. Giving rise to a good option in which to open a long position with which to obtain profit.
The fundamental premise to give the buy order at the right time is to wait for the double bottom formation to complete. Thus, the probability of making a profit will be much higher than if the order is processed at the first low of the RSI.
The graph corresponds to the daily evolution of the S&P 500 index. It is possible to observe that after the formation of the double bottom, the index signaled a pronounced upward reaction.
Combine the RSI Indicator with Others
Do you remember that we recommend comparing signals from at least two indicators or an indicator and a candle? It is a crucial rule that will help traders keep their money.
RSI STRATEGY COMBINED WITH MACD
It has already been mentioned above that the RSI is a highly recommended tool for trading operations. But to increase the probability of making a profit it is advisable to combine the use of RSI with other technical indicators such as MACD, Stochastic or Moving Averages. The combined use of technical indicators helps to confirm the optimal situation in which to open and close positions.
Here a strategy is developed that consists of combining the opening and closing information provided by the RSI with that provided by the well-known MACD indicator.
The MACD indicator signals to consider are:
- Buy signal if the MACD line crosses the Signal line from bottom to top.
- Sell signal if the MACD line crosses the Signal line from top to bottom.
Get a Trend
The RSI is used to determine a trend reversal in the stock market, or in the market. That is why trend indicators will be the right addition to that. Combine signals from moving averages or the Ichimoku Kinko Hyo with the RSI.
Frequently Asked Questions
– Something We Haven't Said About the RSI Indicator
Here, we've rounded up the most frequently asked questions you might have.
What Is The Best RSI Setting?
The only setting you need to change is the index period. Period 14 is a standard setting. However, it is not the best. Forex traders mainly use the 9 period for shorter timeframes and the 25 period for longer timeframes.
What Is The Best RSI Setting For Day Trading?
When trading within a day, use small timeframes from one minute to four hours. That means, the indicator must have a period no greater than 14. 8 or 9 are the most used periods. However, you can reduce the period as much as you want. Just remember that short periods increase the risks of false signals.
What is an RSI Buy Signal?
If you want to buy, wait until the index crosses the ascending level of 30 levels. However, don't buy breaking the 30 level in the strong trend. Another buy signal may appear when the downtrend changes. Wait for the bullish divergence (a higher low of the RSI and a lower low of the price).
Conclusion
Now, you are ready to put this new knowledge into practice. However, don't rush. You could get confused by the various levels and functions of the indicator that we explained above. Take your time to learn how the indicator works – choose the best period settings for your strategy. We recommend you to apply various RSI indicators on the chart with different settings and then see which signals work best. Use a Libertex demo account to practice this technique.