Ichimoku Technical Indicator
The Ichimoku technical trend indicator (Ichimoku Kinko Hyo) was developed in the 1930s and published in 1968 by a Japanese analyst, Mr. Goichi Hosoda, who published under the pseudonym Sanjin Ichimoku. Initially used to analyze the Nikkei stock index.
The author's goal was to create a universal technical analysis tool that would allow analyzing more details in less time. And the approximate translation of the name of the indicator - “instant look at the balance sheet” - reflects this goal.
The tool, which is a development of candle theory, combines several approaches to the analysis of financial markets, including the forex market, and is designed to identify trends and support and resistance levels, generate buy and sell signals. But often traders do not trade on Ichimoku due to the fact that this classic indicator seems too complicated to use.
The full name of the indicator is Ichimoku Kinko Hyo.
The Ichimoku Kinko Hyo is used in both the stock market and the cryptocurrency market in swing trading and mid-term trading . Intraday traders and scalpers generally do not use technical analysis indicators . Market information is analyzed by moving averages that are part of the instrument. Part of the moving averages is executed ahead of schedule, the rest is delayed. There are five of them
Structure of the Ichimoku Kinko Hyo Indicator
- Kijun-sen - the line of the standard (it is also the base), colored in red. This is a 26 period moving average;
- Tenkan-sen - flip line, colored blue. This is a 9-period moving average;
- Senkou Span A . Moving average (purple line), it is calculated by averaging the values between Kijun-sen and Tenkan-sen . On the screen of the trading terminal, it is displayed ahead of 26 periods;
- Senkou Span B . The result of calculating the averaging of extremes (highs and lows) for a period equal to 52. The moving average in the form of an orange line is displayed ahead of 26 periods;
- Chikou Span . Moving average in the form of a green line with a delay. Consists of the current closing prices displayed 26 periods behind.
The cloud is the area defined by Senkou Span A and Senkou Span B.
If Senkou Span A is above Senkou Span B , the cloud turns green. The red space indicates that Senkou Span B is above Senkou Span A.
These two lines are leading indicators, because make a forecast for the next 26 periods. Chikou Span is a lagging instrument that displays information 26 periods ago.
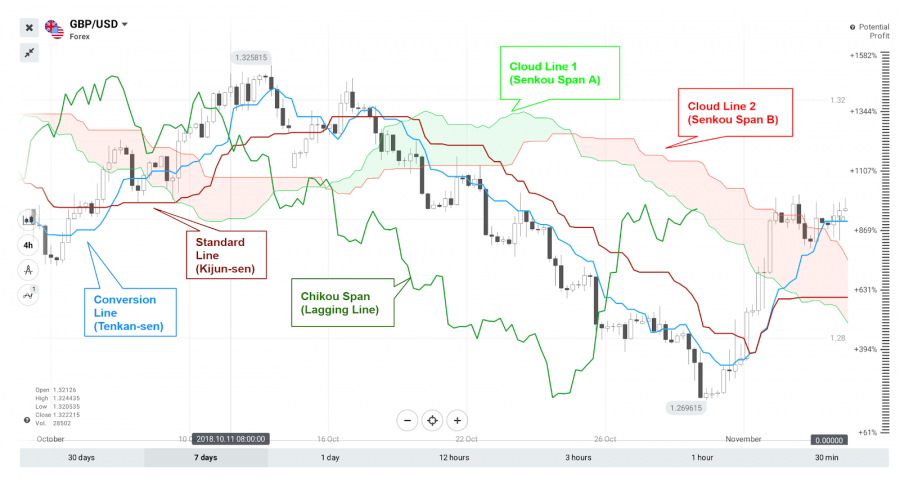
Settings of Ichimoku Kinko Hyo Indicator
Studies and tests of the indicator in practice have confirmed the best trading results when choosing the Ichimoku Cloud indicator values for the periods 9, 26 and 52.
These are the standard settings. However, in the cryptocurrency market, for their trading strategies and goals, traders prefer to change them to 10, 30 and 60, respectively. The debate over optimal settings continues.
Principle of operation
The Ichimoku cloud strategy involves the use of moving averages not on closed candles, but on calculated average values ??of highs and lows for a specific period.
For example, the standard line is calculated by the formula:
Kijun-sen = (26 high + 26 low) / 2, where high is the high and low is the low for period 26.
What to see in Ichimoku kinko Hyo Indicator?
The principle of operation takes into account two features:
- Using moving Kijun-sen and Tenkan-sen as signal lines for opening deals;
- Using the cloud to display support and resistance areas, price trend direction and momentum.
We'll discuss now the above two principles in detail below.
Buy/Sell Signals by Ichimoku Kinko Hyo Technical Indicator
Ichimoku signals can be divided into 3 sections:
- Conversion Line (Tenkan-sen) and Standard Line (Kijun-sen)
- The Cloud: Cloud Line 1 (Senkou Span A) and Cloud Line 2 (Senkou Span B)
- The Outdated Line (Chikou Span)
Conversion Line (Tenkan-sen) and Standard Line (Kijun-sen)
The Ichimoku cloud is made up of five main components. The first are the Conversion Line (Tenkan-sen) (9 periods) and the Standard Line (Kijun-sen) (26 periods) which act as dynamic lines of support and resistance.
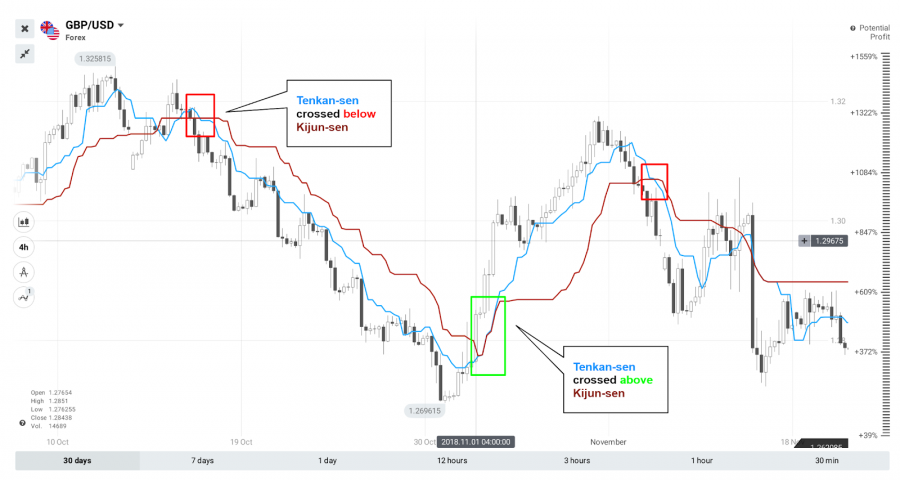
In the screenshot above you can see the two types of crossing between both lines. Normally the crossing of the Fast Conversion Line (blue) above the Standard Line (red) indicates an uptrend or reversal, while the opposite indicates a downtrend or reversal.
The Conversion Line (Tenkan-sen) is calculated (maximum of 9 periods + minimum of 9 periods) / 2
The Standard Conversion Line (Kijun-sen) is calculated (maximum of 26 periods + minimum of 16 periods) / 2
A crossover between the Conversion Line and the Standard Line indicates an uptrend reversal while the opposite indicates a downtrend or reversal
The Cloud: Cloud Line 1 (Senkou Span A) and Cloud Line 2 (Senkou Span B)
Next is the cloud . The cloud is made up of two lines, called Cloud Line 1 (senkou Span A) and Cloud Line 2 (Senkou Span B). Both are charted 26 periods into the future , which means they are offset 26 periods ahead of the last candlestick.
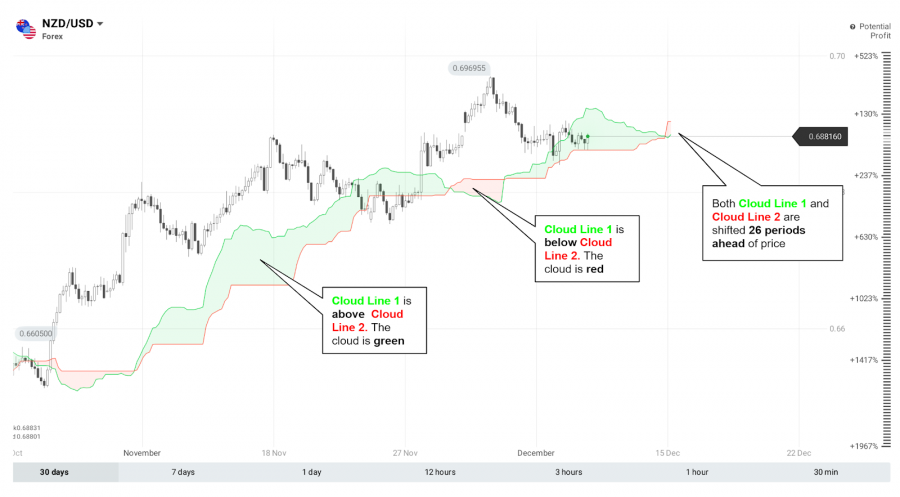
How do you read your signs? Normally, if Cloud Line 1 is above Cloud Line 2, the cloud is green , indicating a bullish trend , while in the opposite scenario, the cloud is red , indicating a bearish trend.
Cloud Line 1 (Senkou Span A) is calculated (Tenkan-sen + Kijun-sen) / 2
Cloud Line 2 (Senkou Span B) is calculated (high of 52 periods + low of 52 periods) / 2
Cloud Line 1 (Senkou Span A) above Cloud Line 2 (Senou Span B) indicates a bullish outlook, while the opposite scenario indicates a bearish outlook
The Outdated Line (Chikou Span)
Last but not least comes the Outdated Line (Chikou Span ). It is curious that there are so many difficulties in understanding it, and many investors do not know what it is or how to use it. Understanding how to use this line is critical to making the most profitable trades.
In a nutshell, this line exactly follows the closing price of each period but is shifted back 26 periods. In essence, the Lag Line (Chikou Span) is a graph line shifted back 26 periods.
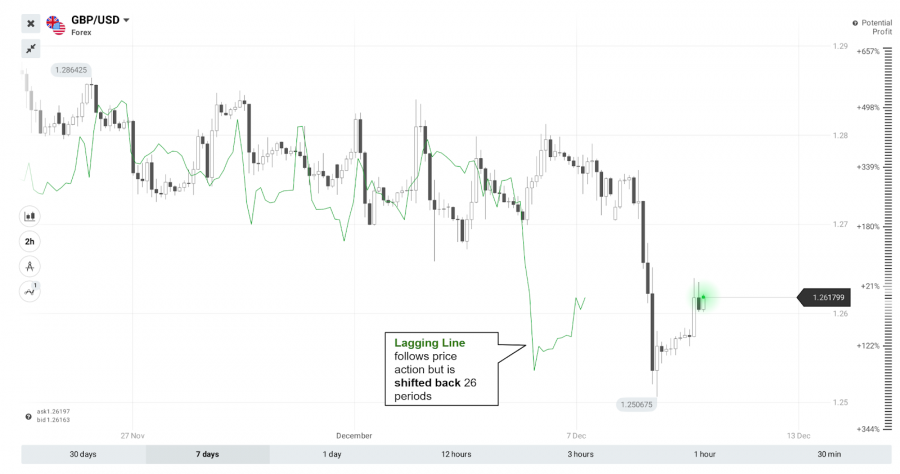
Typically when the Gap Line crosses below past price action , the odds of a valid bearish move or reversal increase.
The Lag Line (Chikou Span) above the past price action indicates a bullish trend, while the opposite scenario indicates a bearish trend
How to use the Ichimoku Cloud strategy? 3 confirmations to improve the odds
The Ichimoku Cloud indicator is considered to provide reliable buy and sell signals for a reason. Unlike other indicators, the Ichimoku Cloud indicator can give multiple confirmations which together increase the odds of a valid buy or sell signal. That is why, as mentioned above, this indicator can be used on its own, while most indicators work better in combinations.
Here are 3 confirmations for a valid buy/sell signal:
1. Bullish Closing Price Outside the Cloud
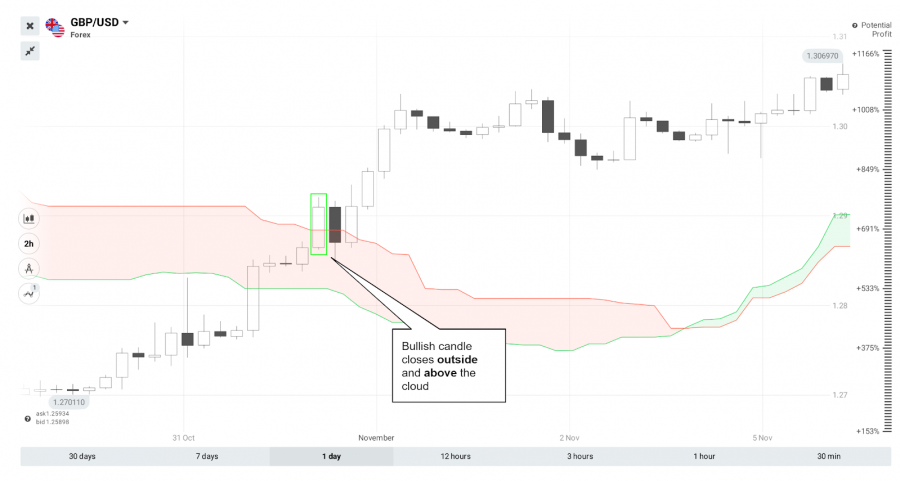
The first and most critical condition for a valid buy signal is a bullish candle closing above and outside of the cloud for the first time. Such a breakout can be considered a signal that the price may continue its upward movement. For a valid sell signal , a bearish candle should close outside and below the cloud for the first time.
2. Price is Above the Conversion Line (Tenkan-sen) and the Standard Line (Kijun-sen)
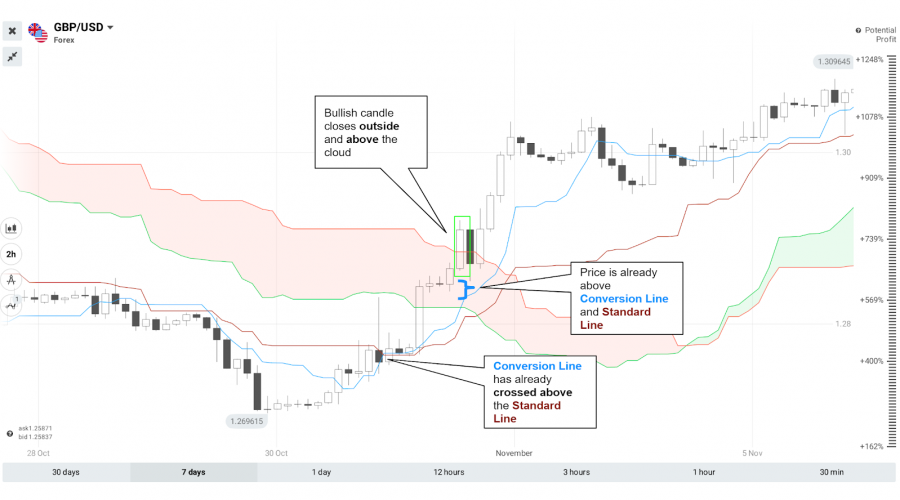
The second condition requires the bullish candle to close above the conversion line and the standard line . Also, the conversion line should already have crossed over the standard line .
For a sell signal, the bearish candlestick closes below the conversion line and the standard line . Also, the conversion line should already have crossed below the standard line .
3. The Bullish Lag Line (Chikou Span) crosses above the past price action
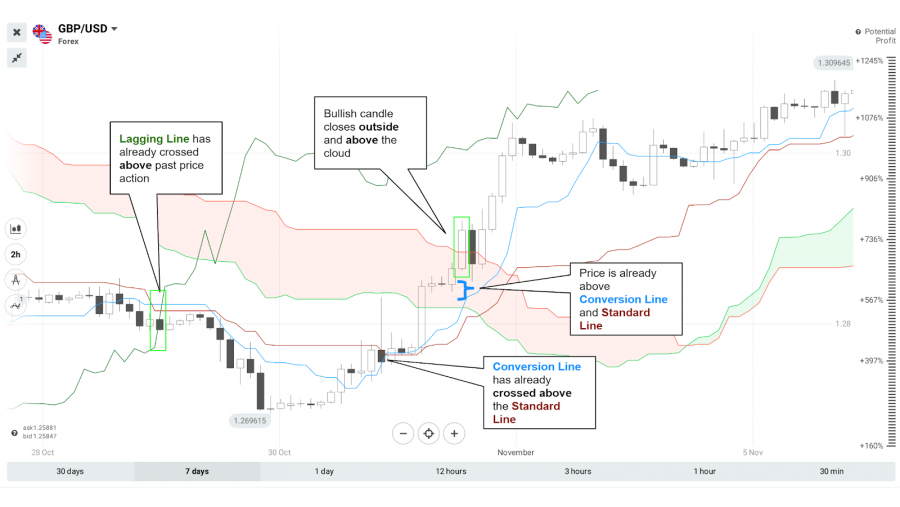
Last but not least, for the odds of a valid buy signal to increase, the gap line should have already crossed above the previous price action.
Similarly, for a valid sell signal, the lagged line should have already crossed below the previous price action.
Summary of all Signals of Ichimoku knko Hyo Technical Indicator
- Chikou (Lagging) - Represents the last closing price moved back 26 periods. It helps to confirm signals: if it crosses the chart from the bottom up, this is a buy signal, and if it crosses the chart from the bottom, it is a sell signal. Basically, Chikou is a trend filter.
- It is quite simple to read the chart with apparent complexity: you need to determine where the price is now relative to the Senkou A or Senkou B lines. If the asset price is above the cloud, this means that the trend is up (bullish), the cloud should be green. The top of the cloud will be the first support level, followed by the bottom of the cloud during a deep correction.
- If the price of an asset is below the cloud, this indicates a downtrend (bearish) and the cloud should be red. Its lower part will be the first resistance level, followed by the upper part of the cloud during a deep correction.
- That is, this area is perfect for filtering signals between the phases of the bear market and the bull market . When trading Ichimoku clouds, it is important to remember that the wider the cloud, the stronger the trend. It is not recommended to trade when the price is inside the zone, this may indicate a flat. But at such moments, you can use the top of the cloud as resistance, and its lower part as support.
- “Golden Cross” (TK Cross) - the intersection of Tenkan and Kijun. When the fast signal line crosses the slow one from the bottom up, it is a buy signal. If during the intersection the price is above the cloud, this gives a strong signal to buy. An additional signal is the moment when the Chikou line crosses the price chart at the crosshairs.
- “Dead Cross” - reverse crossing, downward. When Tenkan crosses Kijun from top to bottom, it is a sell signal. If the price at this time is below the cloud, this gives a strong signal to sell.
- Tenkan-sen crosses Kijun-sen from bottom to top. This is a bullish signal. A convenient moment for opening long positions (purchases);
- Tenkan-sen crosses Kijun-sen from top to bottom. Bearish signal. Opening short positions (sales);
- When the Chikou Span crosses the price trend. Trades are opened in the direction of the trend intersection.
- The trend is located above the cloud, the reversal line and the standard line act as support. Price movement is defined as upward.
The trend is moving below the cloud. The reversal line and the standard line act as resistance. The price movement is downward. - The price moves inside the cloud - there is uncertainty in the market. Trading is not recommended while there is a fight between bulls and bears.
- The green color of the cloud confirms the strengthening of the uptrend, the cloud itself is support, the red color is the strengthening of the downtrend and here the cloud is a resistance zone.
- When a bullish crossover of the moving averages below the cloud occurs, and the Chikou Span moving average is above the cloud, it is very likely that we are seeing the end of a downtrend, and the beginning of an uptrend.
- If the cloud is thin, it is a sign of low volatility.
- If the cloud is wide, volatility is high.
Observing the size of the cloud, to confirm the strength of the trend
Few operators take into account the size of the cloud , they only usually look at the price position with respect to it, to determine their orientation.
However, the size of the cloud gives us another piece of information that is just as interesting: the strength of the trend.
When we are in a strong trend, the size of the cloud increases. While when the trend begins to weaken, the width of the cloud will also weaken, until it is reduced to practically nothing when there is no trend.
At that time, it is better to stop and stop using the Ichimoku, since it is a “trend indicator” and the lack of it generates many false signals.
Why Does Ichimoku Kinko Hyo Matter?
Although this indicator consists of many lines that can create noise on the chart, you only need two minutes to catch the signal. No matter what signal it is: a trend reversal, momentum or buy/sell signal, you will always get something. Many lines help the indicator cover different aspects of the market situation. This is why the Ichimoku provides so many signs.
In addition, the indicator is quite accurate. Of course, sometimes it can provide false signals, but its percentage is low.
Common Errors with the Ichimoku Kinko Hyo
It can be difficult to understand the meaning of each line. The most frequent error is the misunderstanding of the lines. Their names and functions are not easy to remember, which is why traders receive wrong signals. All you need to do is select the colors of your choice and determine the color of each line.
The second mistake you may face is market noise. Do not apply too many indicators. We recommend combining Ichimoku with other indicators for more reliable signals, but that doesn't mean you should implement too many. Use only one additional indicator. It is better if it is placed below the chart. Oscillators are always located in the window below the chart. Therefore, you will see the signs clearly.
The next error that you may encounter when using the indicator is the wrong confirmation. The Ichimoku Kinko Hyo has many functions: it can confirm the trend, determine momentum, help set support and resistance levels, and give buy/sell signals. To confirm the signal, you need to find a suitable additional indicator. Sometimes traders are not aware of the functions of other indicators. So they don't get any confirmation or they get the wrong one.
The Best Ichimoku Trading Strategy
To facilitate your first step with the Ichimoku Kinko Hyo indicator, we present you with a trading strategy. Following these steps, you will find a good point to increase your income. You can then implement the indicator in your trading strategy and find other entry and exit points.
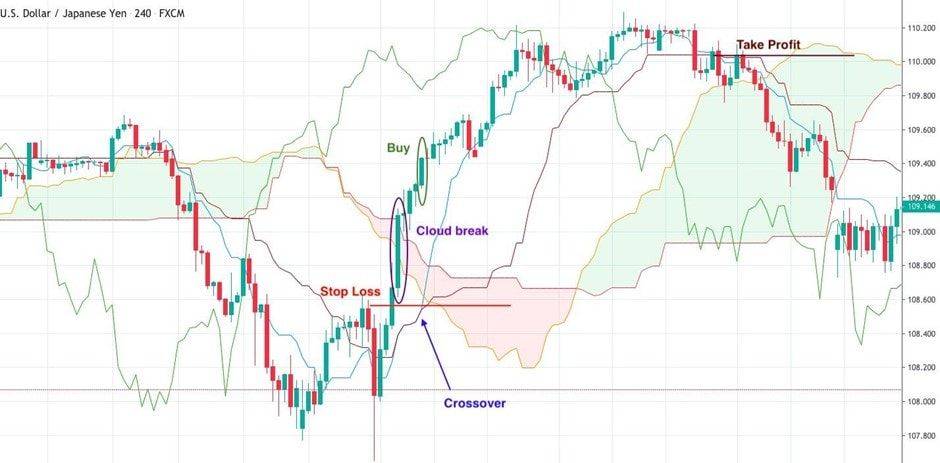
- First, you need to wait for the price to close above the cloud. If the price closes above the cloud, we are more likely to see the uptrend.
- After that, we need the conversion line (Tenkan-sen) to break above the baseline (Kijun-sen). If both conditions are met, we can look for a good entry point for a long position.
- You can open a trade at the open of the candle that took place after the crossover, or crossover.
- Remember the Stop Loss . Place the stop loss 5 to 10 pips below the candlestick that broke above the cloud. You can follow the stop loss with respect to the market situation.
- It's time to use a take profit order. Close the position as soon as the conversion line breaks below the baseline.
This strategy can be applied to a sell position. Just use all the steps in reverse.
Advantages and disadvantages of Ichimoku Kinko Hyo Indicator
The advantages of the indicator include the fact that it is a whole set of tools for trading. It has all sorts of signals (breakout, trend, countertrend), and tools for entering a trade, and places to set a stop loss. Among the advantages can be called applicability with different instruments of the forex or stock market.
If we talk about the disadvantages, Ichimoku, like other trend indicators, can give lagging signals, therefore, it is necessary to use other filters when working with it, for example, ADX.
FAQ About Ichimoku Kinko Hyo
Having learned the basics of the indicator, we know that any trader may still have questions. So, we are here to answer all of them.
What Is the Best Time Period for Ichimoku?
There is no best time frame for the Ichimoku indicator. No matter what term you apply it to, the lines will be calculated based on the term. Therefore, you will get the right signals in any period from one minute to one month.
What is the Best Indicator to Use with Ichimoku?
Ichimoku can be applied to many situations and provide many signals. To find a perfect match, you need to understand what signal you are looking for. If you want to take advantage of momentum, use momentum indicators like the RSI or Momentum. If you want a confirmation of the trend, put in something like the Parabolic SAR or the MACD . If you are looking for a buy/sell signal, you can also use the RSI, MACD or the Stochastic Oscillator.
How is the Strategy with the Ichimoku Cloud?
As we said before, the cloud is the central part of the indicator. It is made up of two lines. The cloud provides a large number of signals. To sum them all up, we can write down three crucial rules.
- Open a position when the price breaks the cloud. The direction of the position will be determined by the direction of the breakout. Keep the position open until the price breaks the Kijun Sen or the baseline in the opposite direction.
- Open a position when the price breaks the cloud. Once again, you will buy or sell depending on the direction of the breakout. Close the position as soon as the Chinoku Span breaks the Tenkan Sen in the opposite direction.
- Open a position when the price breaks the cloud. Choose the direction relative to the direction of the breakout. Close the position as soon as the price breaks the cloud in the opposite direction.
Conclusion
Remember, there are no strategies in Forex that do not make mistakes. Therefore, the use of the Ichimoku Ichimoku Kinko Hyo indicator strategy, like any other, requires confirmation of its signals. When building your own strategy, use multiple indicators.
Follow Money Management. Never risk more than 2% of your capital on a single trade. This approach will protect you from ruin and allow you to consistently earn on Forex using the Ichimoku indicator.
Strictly follow your trading strategy. If, according to the strategy using the Ichimoku Ichimoku Kinko Hyo indicator, you need to open a deal - open it, if you fix the result - fix it, and it doesn’t matter if you are in the black or not. Only following the rules of the Ichimoku indicator “from and to” will allow you to earn.
The Ichimoku Cloud indicator is universal. It determines the direction of the trend, its strength, support and resistance levels, generates market entry signals. During the market consolidation, the instrument indicates the nearest cardinal changes in the cryptocurrency price movement. This is especially important in long-term trading.