Heikin Ashi » Tutorial with Examples
The Heikin Ashi (HA) candlestick filters out the “noise” of daily price changes, making it a popular indicator for trend traders. Heikin Ashi candlesticks are an excellent technical analysis tool used to identify trends and potential reversal points on the price chart. They are particularly good at placing long positions.
Learn how to incorporate Heiken Ashi candlesticks into your technical analysis.
What is the Heiken Ashi candlestick?
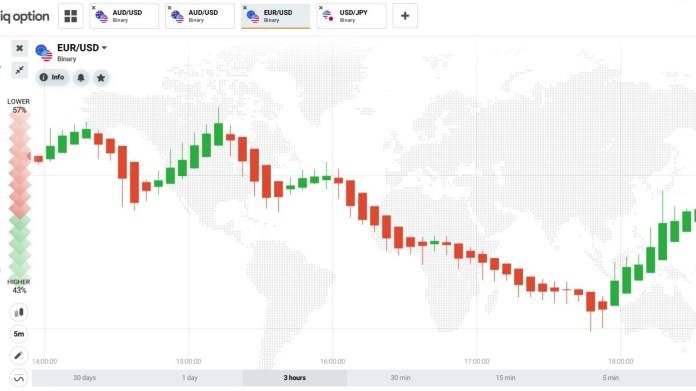
The Heiken Ashi candlestick (also known as the HA candlestick) means “medium candlestick”. It is a very special type of candlestick. In appearance, the color is no different from Japanese Candlesticks. But the calculation to create a candlestick, Heiken Ashi is very different. Its most important part is the average value.
How to calculate Heiken Ashi Candlestick?
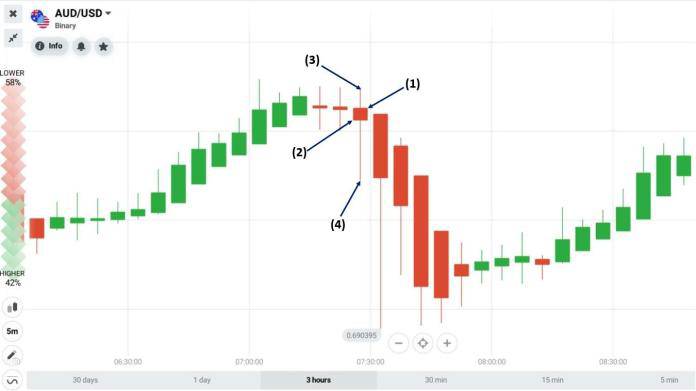
These candles use the open and close prices of the previous period as well as the open, close, high and low prices of the current period. The formula for each candle is calculated as follows:
(1) Open price of HA candlestick = Average close and open price of previous HA candlestick = (Previous HA open price + Previous HA close price) / 2.
(2) Closing price of candlestick HA = Average closing price, open, high and low of current candlestick = (Open price + Close price + High price + Low price) / 4.
(3) High HA candlestick = choose the highest level from 3 levels, including high price, HA open price or close price.
(4) Low HA Candlestick = Choose the lowest level from 3 levels i.e. Low Price, HA Open Price or Close Price.
How does the Heiken Ashi candlestick pattern work?
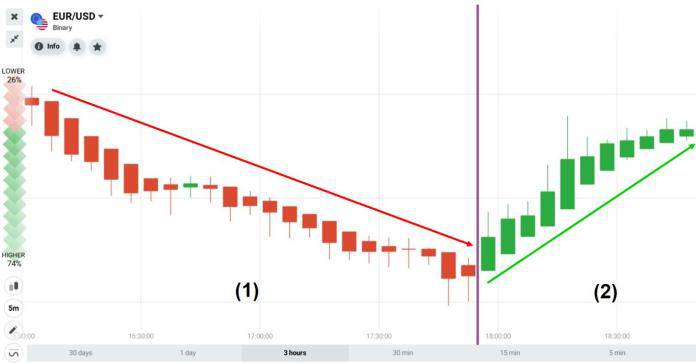
Due to the above calculation, when you observe the Heiken Ashi candlestick chart, you will see like this.
The difference between Japanese Candlesticks and Heiken Ashi Candlesticks
| Heiken Ashi candlestick | Japanese candlestick | |
|---|---|---|
| Popularity | Few people use it as most of them don't fully understand its usage | Used by most traders worldwide |
| Chart | The opening and closing prices are quite complicated. So you need to learn the formula and understand its structure | Opening and closing prices are easy to understand |
| Trend forecast | Medium and long term | Short term and medium term |
| Benefit | Filter out bad signals. Very effective in long-term trading when the trend is clear. | Effective when using in short term trading to capture price swings |
Heiken Ashi Reversal Signals
Heiken Ashi shows reversal signals in 2 situations. Let us discuss them withe example.
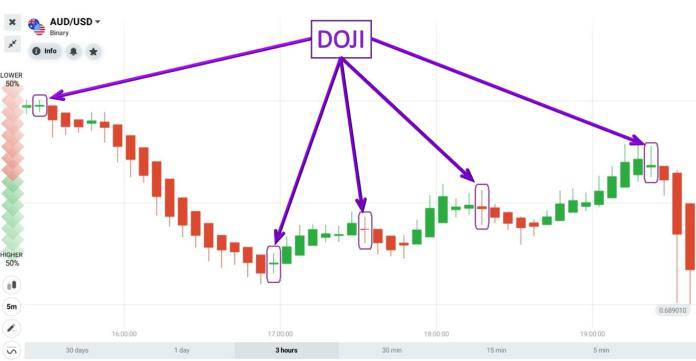
1. Heiken Ashi creates Doji Candlesticks
Much like Japanese Candlesticks, when Heiken Ashi creates a Doji, it shows market limbo. This is the signal that the main trend is likely to stop and reverse. Therefore, when using Heiken Ashi, you should focus on the Candlesticks Doji.
2. Heiken Ashi shows signs of slowing down
It also means that prices are showing signs of slowing down.
For example, when the Red Candlesticks have closing prices equal to or higher than the closing price of the previous candlestick ⇒ the trend is likely to reverse from a downtrend to an uptrend. On the contrary, when the green Candlesticks are equal to or lower than the closing ones of the previous candlestick ⇒ the trend tends to reverse from an uptrend to a downtrend.
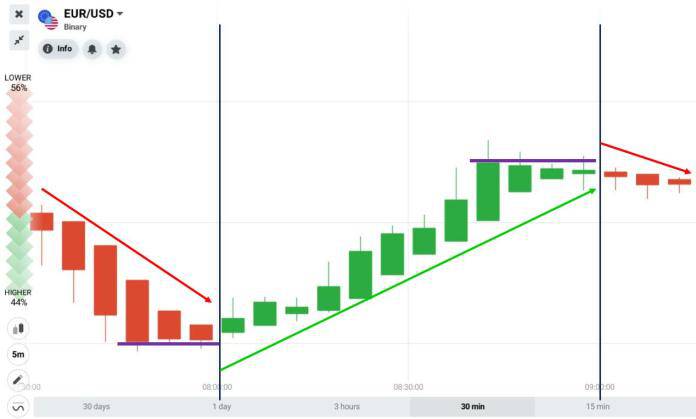
If you use candles for 1 minute, you must hold the position for at least 5 minutes. But if you are trading on 5-minute period candles, like in the example above, your trade should last at least 15 minutes.
Heiken Ashi Candlestick Trading Strategies
We'll now discuss 5 major Heiken Ashi Candlestick trading strategies:
-
Heiken Ashi candlestick pattern combines with RSI indicator
-
Breakout of the Entry Point with the Heiken Ashi Candlestick Pattern
-
Identify a strong bearish or bullish movement
-
Look for candlesticks without shadows
-
Small body candles indicate trend breaks or reversals
1. Heiken Ashi candlestick pattern combines with RSI indicator
We will combine the reversal signs of the Heiken Ashi candlestick pattern into oversold or overbought areas.
Requirements: 1 minute Heiken Ashi candlestick pattern + RSI indicator. The expiration time is 5 minutes.
Trading technique:
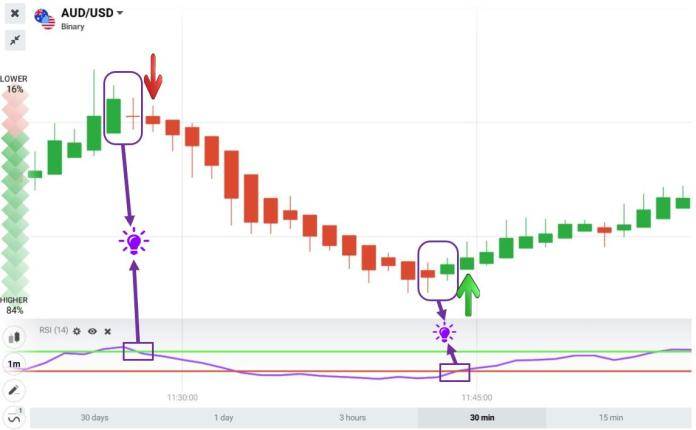
HIGHER = Heiken Ashi changes from a downtrend to an uptrend + the RSI rises from below the oversold area and cuts 30.
LOWER = Heiken Ashi changes from an uptrend to a downtrend + the RSI drops from above the overbought zone and cuts 70.
2. Breakout of the Entry Point with the Heiken Ashi Candlestick Pattern
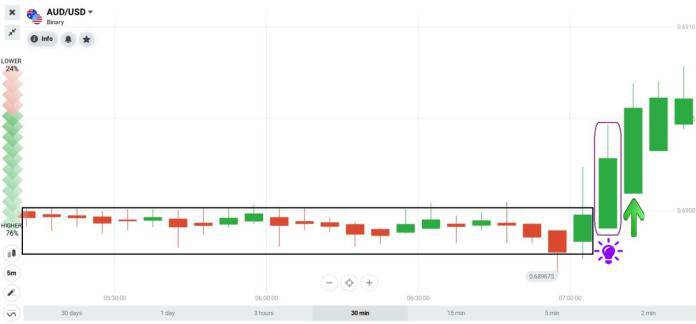
Open options when price breaks the sideways period and flies like a rocket.
For example, the price moves sideways, creating alternating Candlesticks But “BOOM”. It escapes the sideways period, rises sharply, and creates green Candlesticks. This is a strong uptrend ⇒ Open options HIGHER.
3. Identify a strong bearish or bullish movement
The most common application of Heiken Ashi is to identify when a trend reverses and takes a new positive/negative move. Due to the mechanics of the candlestick methodology, these signals are considered to be very reliable. A trader can follow the trend and be sure that the signal is trustworthy.
In the example below, you can observe two particular times when the candles turn from red to blue. What these two situations have in common is that they are followed by strong bullish movements.
Traders with short positions, in this situation, might want to exit, while those with long positions will increase them.
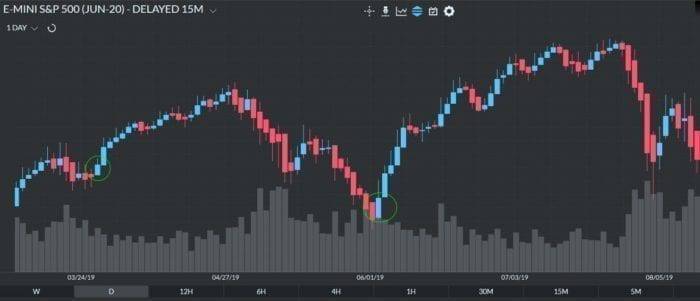
As you can see, the Heiken Ashi is rarely wrong. In the example above, the Japanese candlesticks would have generated several misleading signals, which novice traders might have believed, leading to losses.
4. Look for candlesticks without shadows
This is one of the most successful Heiken Ashi trading strategies. Candlesticks without a lower shadow are a very likely signal that a strong uptrend is forming.
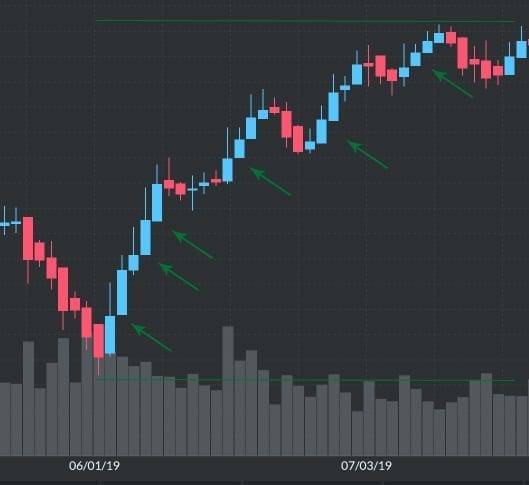
The larger the series of wickless candles, the stronger the expected trend will be.
As you can see in the example, the market is continuously and steadily rising. All positive trend continuation moves have these areas in common with a strong presence of wickless candles.
On the other hand, it is clear that the indications coming from the candles with lower shadows are short-lived.
The same applies to downtrends. If you spot a series of candles with no upper shadows, expect the market to enter a new bearish stable move.
5. Small body candles indicate trend breaks or reversals
Also make sure to be careful when small body candles start to appear. Traders use them to determine when the trend is about to stop or reverse. When this happens, they open a position because there is a good chance that the current trend is coming to an end.
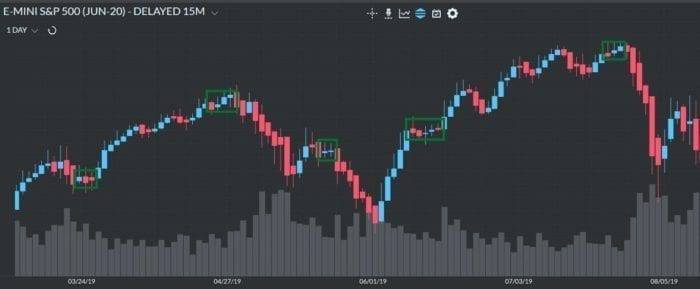
However, it is worth mentioning that you should not act rashly just because the next candle changes color. This might not be another reversal, just a break in the trend. In the example below, you will see several areas on the S&P 500 chart where small-bodied candles are initiating trend reversals or breaks.
Heikin Ashi in a nutshell
-
The Heikin Ashi (HA) is a type of chart that uses daily averages to show the evolution of the median price of an asset
-
Regular candlesticks display four different price levels of an asset during a specified time frame, while HA candlesticks use data from the current and previous sessions to calculate these values
-
Heikin Ashi charts can be useful as part of a scalping, day trading or position trading strategy
-
When reading an HA candle, the high of the candle corresponds to the highest price and the low of the candle corresponds to the lowest price
-
If the candle is green, the closing value is higher than the opening value. It is represented at the top of the body of the candle
-
If the candle is red, the closing value is lower than the opening value. It is represented at the bottom of the body of the candle
-
A green Heikin Ashi candle with a long body and no lower wick is considered a sign of a strong uptrend
-
A long-bodied red HA candle with no upper wick is considered indicative of a strong downtrend
-
Since HA candlesticks show the directional trend of the market, it can also be useful to apply trend indicators (moving average, RSI and ADX) in order to identify the strength of market momentum.
-
To trade using the Heikin Ashi indicator, you can use derivatives such as CFDs
Are Heikin Ashi candles better?
The Heikin Ashi chart is another form of presenting price data over time. These candles are very similar to Japanese candles. However, it is important to note that their OHLC values do not represent the actual OHLC values of a candle. These values are transformed mathematically, so that the Heikin Ashi itself acts somewhat like an indicator for technical analysis. Thus, Heikin Ashi candles contain additional information, and when combined with an indicator such as the aforementioned Stochastic Oscillator, they can be a good trading strategy.
Japanese candlestick charts, on the other hand, have the added benefit of having identifiable candlestick patterns, which also have predictive value. Candlestick patterns cannot be used on Heikin Ashi candles.
Both can be used in trading, regardless of the investment style you prefer. Day trading and swing trading use both chart formats.
Management of these Forex transactions
We need to place our stop loss when entering a trade and in this case a distance above the pivots highs would be a decent point. You don't want it just past the pivot because you'll be the victim of stop chases from time to time.
You can set profit targets at pivot lows that occur before pullbacks. You can also take advantage of one of the best things about Heikin Ashi trading and that is using the same exit method as you do for entries. You can exit your trade once the color has reversed.
If you want more active management during the trade, try to trail your stop and tighten it when the presence of upper shadows (in a downtrend) are displayed on the HA candles as this indicates weakness.
Advantages Of The Heiken Ashi Candlestick Strategy
Some of the major advantages of using Heiken Ashi Candlestick are:
Filters market noise
Today's financial markets are filled with noise. This is due to small price fluctuations that can distort the trend and distort the real picture. Many traders find it difficult to navigate noisy markets, which is why they often rely on Heiken Ashi candles. By using this type of chart, they can isolate the noise and see only the true market trend. This way, they can better understand what is driving the price and whether or not it is just simple short-term volatility. This is also very useful for planning entry and exit points.
A better indication of the trend
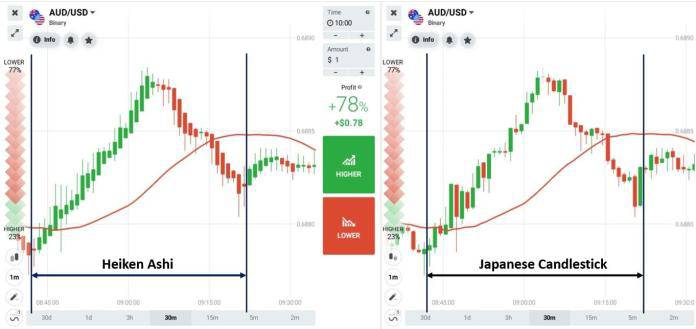
Heiken Ashi candles represent the market trend much more accurately than traditional Japanese candlesticks. This is better understood if we take an example.
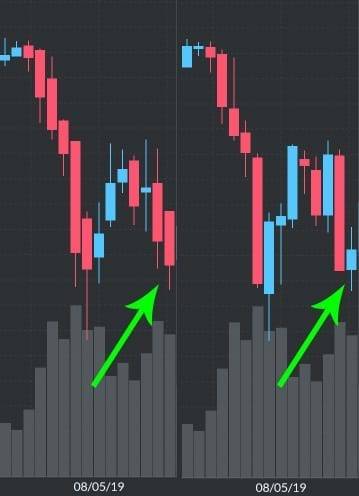
In the first image, you can see a Heikn Ashi chart on the left which indicates that the trend is still in a strong bearish move.
On the right image, however, you see a traditional Japanese candlestick chart. It suggests that the bullish sentiment is strengthening. If the trader takes this into account and decides to go long, he will buy in the middle of the downtrend and suffer losses.
The traditional candle thus closed in blue. Meanwhile, the Heiken Ashi reveals that the S&P 500 is still in a bearish move.
Improves chart readability and highlights signals
Traders like Heiken Ashi charts because they make the trend easier to read. They indicate, for example, when to follow the trend and when to head for the exit, when it begins to weaken. In other words, this charting technique builds traders' confidence by showing that a particular opportunity (entry or exit) is indeed available. Compared to traditional charts, there is less chance of it being a false signal.
Disadvantages Of The Heiken Ashi Candlestick Strategy
Ofcouse, with advantages, this Heiken Ashi candlestick comes with some disadvantages also. They are:
Does not reveal exact prices
Since Heiken Ashi candles are averages, they cannot reveal exact open and close prices. What the trader can actually see is the HA closing price. While for long-term traders this is not a problem, the limited price information does not bode well for more active traders. They prefer traditional Japanese candlesticks, which are derived from actual prices and visualize the open and close values ??on the chart.
Not suitable for active traders (day speculators or scalpers)
The reason is that the Heiken Ashi candles are based on the information of two periods (current and previous). This means that they need more time to develop.
While long term traders are not as time sensitive, scalpers and day speculators might find this problematic. Due to the specifics of their trading strategies and the fact that they try to exploit price opportunities as soon as they arise, they generally avoid trading setups that take longer to develop. This is the reason why they are more inclined to use traditional Japanese candlestick charts.
The absence of price differences
A large portion of technical traders use price gaps to analyze price momentum, trigger entries, or place their stop loss orders. The problem with Heiken Ashi candles is that they don't have a price gap. However, the truth is that this limitation can be successfully avoided if during the trading session the trader switches from Heiken Ashi candles to traditional Japanese candles.
Conclusion
Heiken Ashi is one of the best trend indicators and the lag is not a major drawback. Opening with a delay of 1-2 candles allows you to enter a really strong signal and close exactly at the end of the trend.
They do not react to random market fluctuations, they perfectly show medium and long-term movements, but it is better to open positions only after additional confirmation of binary signals , not during the flat period.