Chaikin Money Flow - How to use Technical Indicator
Chaikin_Cash_Flow Chaikin_Money_Flow Chaikin_Cash_Flow_tutorial Chaikin_Money_Flow_tutorial
Chaikin Money Flow(CMF), Chaikin money flow is a technical analysis indicator used to measure the amount of money flow over a certain period of time. Cash flow volume is a metric used to measure the pressure to buy and sell a security in a single period. The CMF then sums up the amount of cash flow for a user-defined period. Any period can be used, however the most popular settings are 20 or 21 days. Chaikin's cash flow value fluctuates between 1 and -1. The CMF can be used to further quantify changes in buying and selling pressure and can help anticipate future changes.
Calculation of Chaikin Money Flow
The calculation of CMF (Chaikin's cash flow) takes place in three stages, consider an example with a period of 21 days:
1. Find the cash flow multiplier:
[(Close - Low) - (High - Close)] /(High - Low) = cash flow multiplier
2. Calculate the amount of cash flow:
cash flow multiplier * volume for a given period = cash flow volume
3. Calculate CMF
sum of cash flow volume for 21 days / volume for 21 days = CMF
Reading Signals of Chaikin Cash Flow
The value of the Chaikin indicator fluctuates around zero. The basic application of signals is based on the sign of the indicator value: a positive value is a buy sign, and a negative value is a sell sign . But besides these simple signals, there are others, namely:
- duration of stay in one of the halves of the plane
- absolute value of the indicator
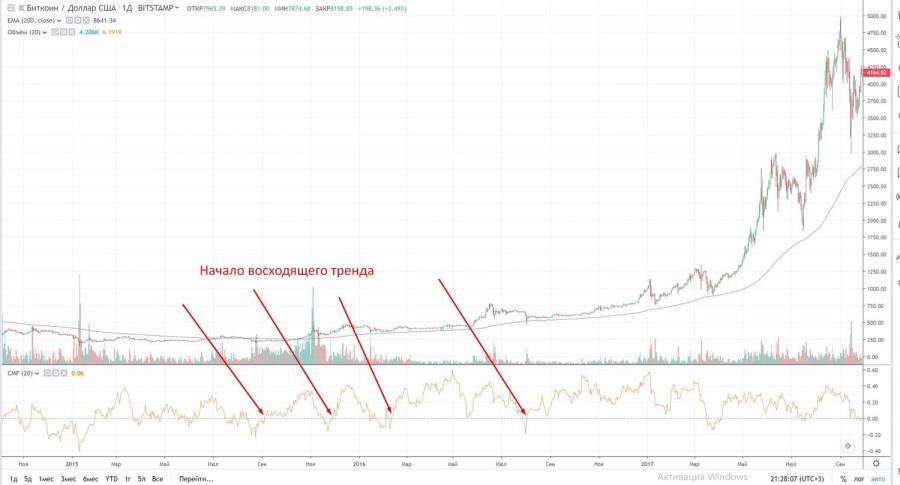
In other words, if the Chaikin Money Flow is in positive territory for a long time, increases, and exceeded the mark of 0.25, then this is a fairly strong bullish signal for market players. Accordingly, if the indicator is negative and falls lower and lower, then this is a sign to sell.
As a rule, values of ±0.1 and ±0.25 are key to the decision. If the indicator has exceeded ±0.25, then this is a fairly strong signal. But it is also worth comparing the indicator value with previous values: is there support or resistance? — is the current value the lowest bottom?
If the trend inside the indicator chart is clearly down, then this is a strong sell sign, and if the indicator shows a strong uptrend, then this is a buy sign.
On the chart above, the places where Chaikin Money Flow has taken a fairly high value, showing a bullish mood in the market, are marked in green; after that the price went up.
Trading with Chaikin Money Flow, RSI and Moving Average
We will trade to buy. To trade in the opposite direction (to sell), you should use the reverse rules. All actions fit into the following scheme:
1. First, let's look at the main indicator - Chaikin's cash flow . As soon as it crosses the zero level from the bottom up, this will be a buy signal.
2. But the received trading signal needs to be confirmed. For this, we turn to the moving average - it should be directed upwards, and the price should close above it. Once this has happened, we move on to the last indicator - RSI.
3. Well, if the RSI at this time leaves the oversold zone (level 30), this will be a strong confirmation. But it is enough that it is near it and tends to increase.
4. If all Forex signal indicators“given the go-ahead” - open a deal to buy.
5. Stop loss can be set several points (depending on the volatility of the currency pair) below the last local minimum.
6. Take profit can be set at the level of the recent local high, or use the Fibonacci levels, or not set at all, but exit the market based on reverse signals.
Chaiken Money Flow technical indicator tutorial with image examples and successful strategy explained
