Average Direction Index (ADX) Technical Indicator Tutorial
The Average Directional Movement Index (ADX) technical indicator helps to determine the presence of a price trend. It was developed and described in detail in the book “New Concepts of Technical Trading Systems” by Wells Wilder.
What is ADX Indicator: Definition and History
ADX (Average directional Index, DMI) is a trend oscillator that shows the direction of the trend and its strength. Represents one main, solid ADX line and two auxiliary, dotted lines - +DI (+Di), -DI (-Di), which are placed under the price chart.
Almost, every trading platform has in-built feature to add ADX indicator to chart. Once added, it will appear below the price chart. The chart will look something like this:
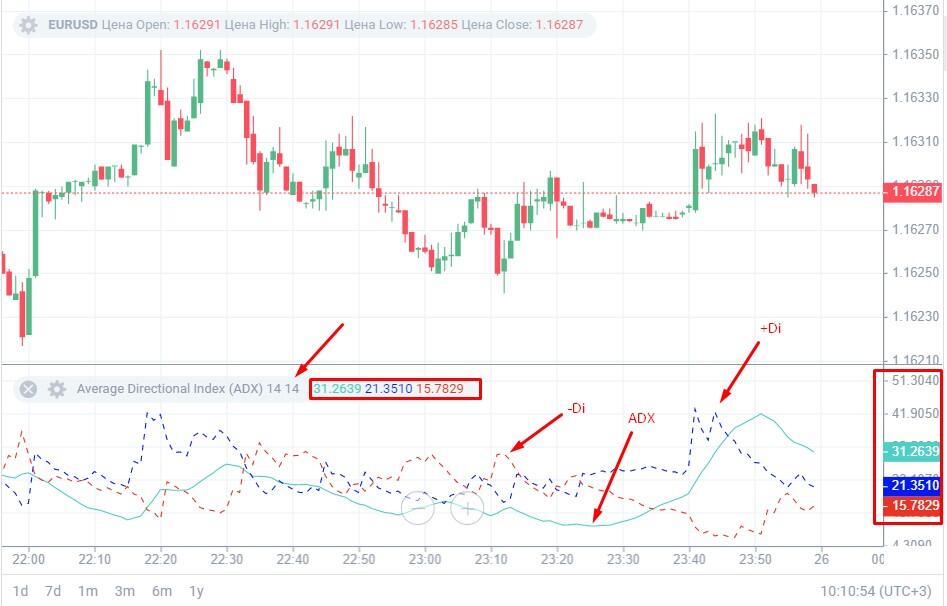
The dotted lines are the additional +DI and -DI lines, the solid line is the ADX indicator line. The top line displays the settings and current values ??of the levels of each line. You can see the same levels on the right. The font color of the level matches the color of the line.
What does the ADX average direction indicator show.
The nature of the price movement is of two types: horizontal movement in a narrow range, called “sideways” or flat. And a trend move up or down. One of the groups of trading systems involves searching for signals at the moment the price exits the flat and opening a deal at the start of a trend movement. But:
- How strong is the trend? Will the price reverse in a few candles?
- Is the breakdown of the boundaries of the flat range really the beginning of a trend, or is it just a correction?
The index helps answer these questions.
What you need to know about the ADX indicator:
- The index measures the strength of a trend, regardless of its direction. It takes the same value for both upward and downward price movements.
- The indicator movement range is from 0 to 100%. Value from 0 to 20% - the strength of the trend is insignificant. From 40% and above - a strong trend. The indicator line rarely rises above 60%.
- Asset for trading - any. It is well suited for any currency pairs, including cross rates. There are successful examples of trading on the indicator on the assets of the stock and commodity markets.
Recommendations for the use of ADX:
- Use the directional indicator only on trending price movements. The index determines the direction and strength of the trend, so in a flat it will give a lot of false signals.
- The recommended timeframe is from H1 and higher, the author of the index suggested using the D1 interval. On short intervals M5-M15, the oscillator gives a lot of false signals due to price noise.
- The signal about the beginning of the trend is the exit of the main line of the oscillator from the zone of 0-20% (in some cases 0-25%). A signal about a possible imminent end of the trend is the entry of the main indicator line into the 50-60% zone.
- The ADX index gives the most accurate signals after consolidation - at the moment the price exits the flat. At the moment of sharp price movements against the trend and at the moment of a change in the main direction of price movement, the number of false signals increases.
The history of the ADX indicator
The ADX indicator was first introduced by J. Wells Wilder Jr. in 1978. In his book “New Concepts in Technical Trading System” he described a system of directional price movement, which was called DMS (Directional Movement System). It includes a series of indicators that describe the nature of the trend price movement - its direction and strength. You are already familiar with one of them - this is one of the main MT4 indicators - ATR, the average true range.
Initially, the oscillator was intended for use in volatile derivatives markets - futures and options. Later, the main indicator of the system, the ADX direction index, was repeatedly refined by analysts - smoothness and additional filters appeared. And what you can get acquainted with now is its final version, which was included in the Metatrader platform as one of the basic tools.
Calculation of the ADX indicator
The formula for the average directional movement indicator is complex. But it needs to be understood at least in general terms for the ability to “read” the indicator signals.
ADX builds on two other tools developed by Wells Wilder:
- Positive (+)DI direction indicator. This is an exponential moving average of the difference between the high of the price of the current and the previous period, divided by the true range (TR - true range). The default period of the moving average is 14.
- Negative negative (-)DI directivity indicator. The calculation is similar, but instead of the maximum, the price minimum is taken.
On the chart in MT4 and the LiteFinance terminal, these are dotted lines.
Step-by-step formula for calculating the ADX indicator:
1. Calculate the value of +M and -M:
+M = High(i) - High(i-1)
-M = Low(i-1) - Low(i), where
High and Low - the maximum and minimum price values, i and i-1 - the current and previous periods, that is, the current and previous bars or candles. To avoid redrawing, it makes sense to take the current High and the current Low of the just formed closed candle.
2. Calculate the value of +DM and -DM:
+DM = +M if +M>-M and +M>0;
+DM = 0 if +M
-DM = -M if -M>+M and -M>0;
-DM = 0 if -M
DM can take either the value of M calculated at the previous stage, or 0, depending on whether the condition of the algorithm is met. +M is the absolute positive price movement, -M is the absolute negative price movement.
3. Calculate the +DI and -DI values:
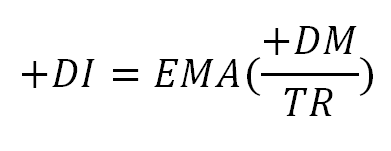
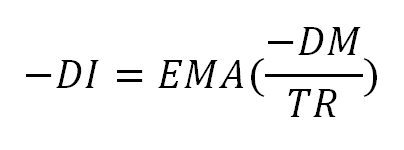
The EMA indicator is an exponential moving average, TR is a true range showing the maximum spread in prices for transactions.
TR = Max (High(i), Close(i-1)) - Min (Low(i), Close(i-1)), where
Max and Min - the highest values ??from the period under review, High and Low - the maximum and minimum value of the candle, Close - the closing price of the candle, i and i-1 - the current and previous settlement candles.
4. Calculate the ADX value:

How to read the ADX indicator
ADX indicator: description and application. The secret of the index's popularity is its informativeness:
The main ADX line shows the strength of the trend.
Additional lines +DI and -DI determine the direction of the trend.
To confirm the signal, the location of all three index lines relative to each other and relative to the range from 0 to 100% is analyzed. Below I will describe in detail each of the signals.
Determining the strength of a trend
Trend strength refers to the extent to which buyer volumes exceed seller volumes or seller volumes exceed buyer volumes. If they are equal, there is a flat on the market, the main line of the oscillator tends to 0. If the order volumes of one of the parties increase sharply, the price starts moving up or down, the indicator line moves towards 100% .
Range indicators of the main indicator line can be interpreted as follows:
0-20% - market equilibrium, the situation is “out of trend”. Traders are in no hurry to place orders and increase the volume of transactions. The price moves in a tight range between strong resistance and support levels. Waiting and observation period.
20-30% - the beginning of a trend movement. The price breaks through the resistance or support level. It is too early to open a trade, as the breakdown may be false. At this moment, it is worth analyzing the position of the +DI and -DI lines relative to each other and for the formation of patterns.
30-40% - confirmation of the trend movement. The best moment to open a deal.
40-50% is a strong trend that is gaining momentum. You can increase the position if there are no opposite signals for other instruments. There is a risk of price reversal.
50-100% - the peak area of the trend attenuation. Here it is worth looking for opportunities to exit the market. This does not mean that the price will reverse. Consolidation or a small local rollback is possible with the continuation of the main movement. But a reversal is also possible.
Using ADX, you can estimate the rate of price change. If the oscillator moves horizontally - the market is flat, if it goes up towards 100% - the strength of the bearish or bullish trend increases, moves to the “0” level - there is consolidation in the market after the trend has passed the peak level.
In some sources, the violet range is called the 0-25% zone. This is true for currency pairs with relatively little liquidity. All values ??of levels and settings are advisory only and depend on the market situation.
Example
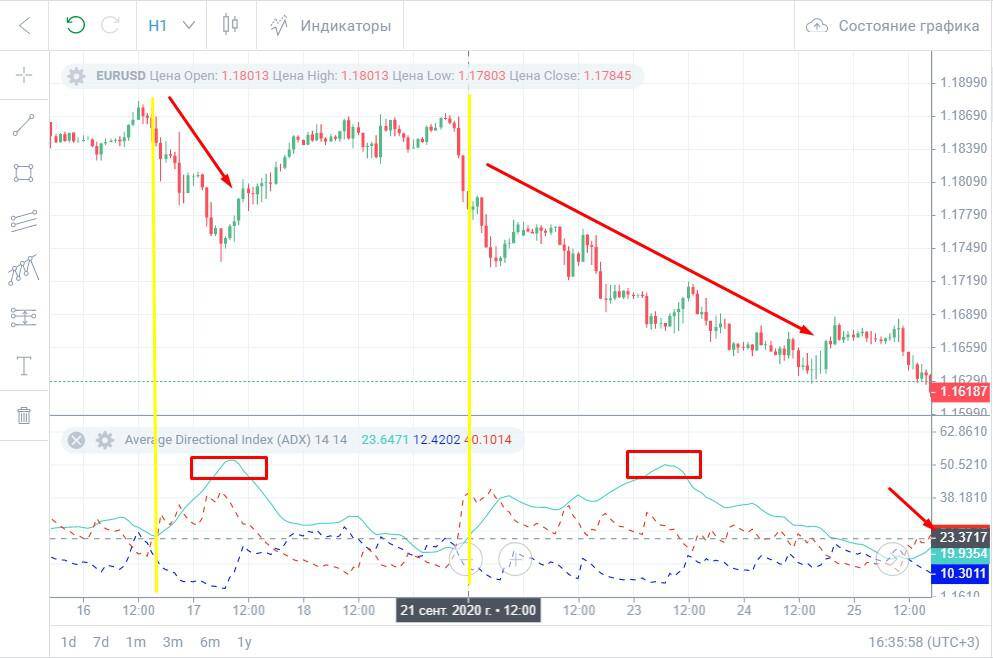
Here is a chart of the EUR/USD currency pair on the H1 timeframe. The gray horizontal dotted line corresponds to the level of 23.3. 20-25% - this is the same signal zone, when the indicator line exits from which you need to look for signals. In both situations, the upward movement of the blue line from the 25% level signaled a trend.
In the first case, the downtrend movement ended as soon as the index reached the 50 level. In the second case, the downtrend continued, but with a gradual transition to a sideways movement.
Determining the direction of the trend
The main ADX line helps to determine only the strength of the trend. The direction is determined by the location of the +DI and -DI lines relative to each other and their intersection.
Position of +DI and –DI lines
Possible positions of the +DI and -DI lines relative to each other:
1.Intersection:
- If after crossing the +DI line is above -DI and continues to move up, an uptrend begins.
- If, after crossing, the +DI line is below -DI and continues to move down, a downtrend begins.
2. Maximum discrepancy:
- +DI above - an uptrend, the main movement of which may end soon.
-DI above - a downtrend, the main movement of which may end soon.
The intersection of the +DI and -DI lines means market equilibrium - the volumes of buyers and sellers are equal. The divergence of the lines after the intersection means that the balance is disturbed. If there are more buy orders, the price starts to rise and +DI goes up. If there are more sell orders, -DI goes up.
The maximum distance between +DI and -DI indicates that the trend is at its peak. The greater the distance between +DI and -DI, ??the more likely it is that a price reversal or temporary consolidation will occur soon. When +DI and -DI begin to converge again, this indicates a gradual fading of the trend.
Example:
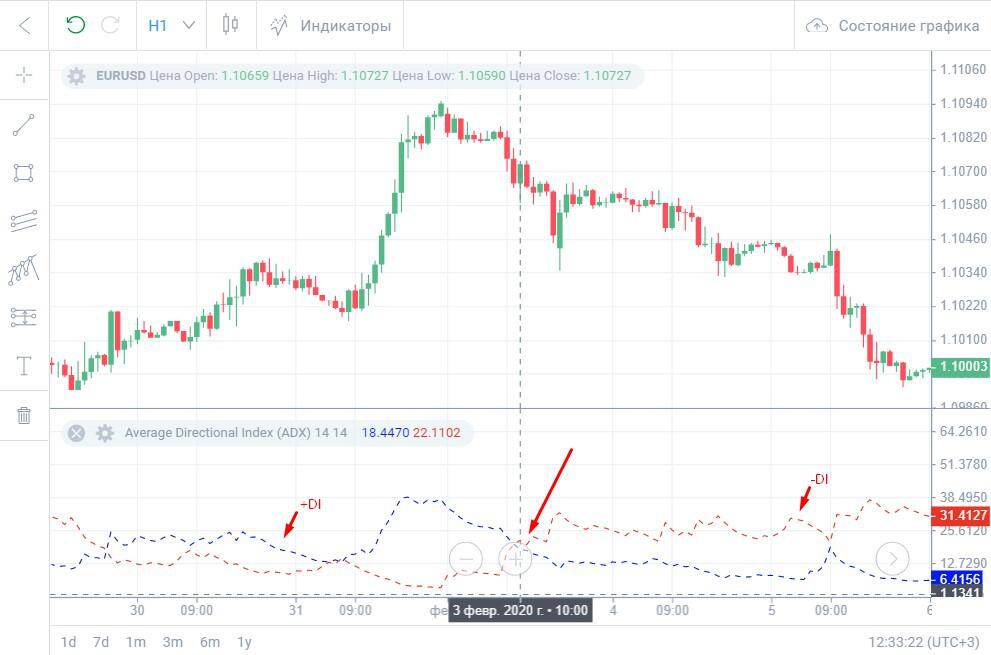
The main index line has been removed so as not to clutter the chart. At the moments of divergence of the lines, an increase in the movement of the trend is seen - the angle of its inclination changes. At the point indicated by the arrow, the +DI and -DI lines are reversed. The signal is lagging - the trend has already reversed. But he confirms that the reversal is not a correction, but the transition of the main bullish trend into a bearish one.
The intersection of the +DI and –DI lines with the growth of the ADX index
Analysis of the position and movement of all three lines relative to each other and relative to the levels underlies an independent trading system:
- If the market is determined to be bearish or bullish, then the distance between +DI and -DI after their intersection increases. Simultaneously with the divergence of the lines, the index crosses the 20% level from the bottom upwards in the direction of the 40-60% zone. +DI above -DI - bullish trend, +DI below -DI - bearish trend.
- If the distance between +DI and -DI decreases, the lines begin to converge and the index line goes down to the 0-20% zone, the activity of traders decreases. A trend reversal or a transition to a flat is possible.
The essence of the ADX strategy is as follows. We are waiting for the dotted +DI and -DI to begin to diverge and at the same time the index line starts to leave the 0-20% zone. We open a deal in the direction of the trend 2-3 candles after the ADX crosses the 20th level. We are looking for the best moment to exit the market at the moment when +DI and -DI after the maximum divergence begin to converge and / or the index line goes down and crosses the 30% level.
Example:
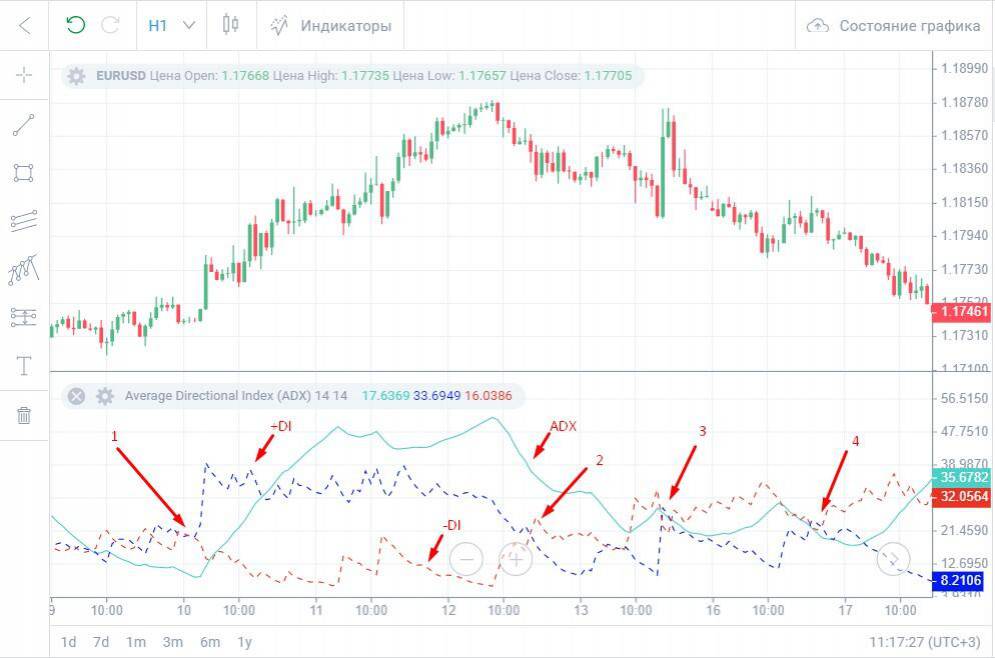
At point “1” a sharp divergence of lines begins. +DI goes up, which indicates a bullish trend direction. ADX indicator starts an upward movement from the level of 12%. As soon as it breaks through the level of 25-30%, you can open a long position.
At point “2”, the +DI and -DI lines are reversed. The main index line has started to decline, but is still close to the 40% level. This suggests that the trend movement is still strong, but a reversal may occur. A short position is opened after 3-4 candles when +DI and -DI diverge after the intersection.
At point “3”, the trend direction can change again - the dotted lines are converging, the index line has turned up. At point “4” we close all short positions, if they were not closed before point “3”, as the indicator line goes below the 20% level.
- Important! Convergence, divergence +DI and -DI, a combination of additional lines with the index line, the exit of the index line into active zones above 30% - these are only auxiliary, confirming signals. I do not recommend using only one ADX to open trades. It is better to add other directional indicators or add Price Action elements to the strategy .
—-
How the ADX indicator works
If the market is flat, the oscillator line is below the 20th level and moves horizontally. The distance between +DI and -DI is minimal. If there is a trend in the market, the oscillator starts to rise, the distance between +DI and -DI increases. The greater the difference between +DI and -DI, the higher the ADX rises. The maximum divergence of the lines of a positive, negative direction and the location of the index line above 40-50% corresponds to the overbought and oversold zones.
Rules and tips for the operation of the ADX indicator
Any technical indicator provides only additional information about the presence of a trend and its strength. The main informative tool is the price chart. First of all, a trader must evaluate the nature of the price movement: the speed of movement in one direction or another, the angle of inclination, etc. And only then focus on the ADX readings.
The strongest price movements occur at the moment of exit from the flat. A flat is a balance between buyers and sellers. Equilibrium, in which the volumes of orders of both parties are approximately equal. The imbalance creates momentum that pushes the price out of the range of the flat. This momentum often becomes a trap for traders. It is taken as a breakdown of key levels, while it has a local character, does not receive confirmation, and the price returns to the flat corridor.
The ADX indicator confirms the price action. Its signals are late, but when the price breaks out of the consolidation zone or changes its main direction, the index shows whether the price really continues a strong trend after a breakout or a local correction is formed on the chart.
The theory of using the indicator assumes the appearance of entry signals in two situations:
1. Opening a deal at the moment of exiting the flat. Simultaneous fulfillment of the following conditions:
- The intersection of +DI and -DI.
- Finding ADX at the moment of crossing below the level of 20% and exit after crossing from the “0-20” zone.
Opening deals only at the intersection of dotted lines gives more than 50% of false signals. The condition of crossing the index of the 20th level from the bottom up is a mandatory condition. It signals that the price is coming out of the flat and a directional trend is emerging. Some sources recommend opening a trade only after crossing the 30th level.
2. Opening a trade at the moment of the reverse intersection of +DI and -DI, ??ADX is above the 40th level. This situation is a logical continuation of the previous one. After the price exits the flat, it reaches its maximum, where a reversal can occur. The index line is still showing a strong trend, while +DI and -DI are reversed. This corresponds to entering the market at the moment of overbought or oversold.
Tips for using the ADX indicator:
- Start technical analysis by evaluating the direction of price movement, formed patterns and levels. Use the indicator to confirm the ideas that come up.
- Try to measure the strength of the trend. Select the signal levels of the main oscillator line for the selected trading asset: “flat zone”, “trend start zone”, “active phase zone”, “overbought/oversold zone”. Let me remind you that an index position below 20% is considered a flat, a breakdown of this level is the beginning of a trend, 30-40% is an active phase, 50-60% and above is an overbought / oversold zone. But for each currency pair, these values ??may differ.
- Choose the optimal +DI and -DI positions for opening a trade. According to the theory, a deal is opened at the moment the lines cross and the index goes beyond the 20th level. Closes at the start of convergence +DI and -DI.
- ADX above 20-25% - use trend indicators, below 20% - use channel indicators and trading strategies within the channel.
How to use the ADX indicator in Forex trading
The theory is understood. Now some practical examples.
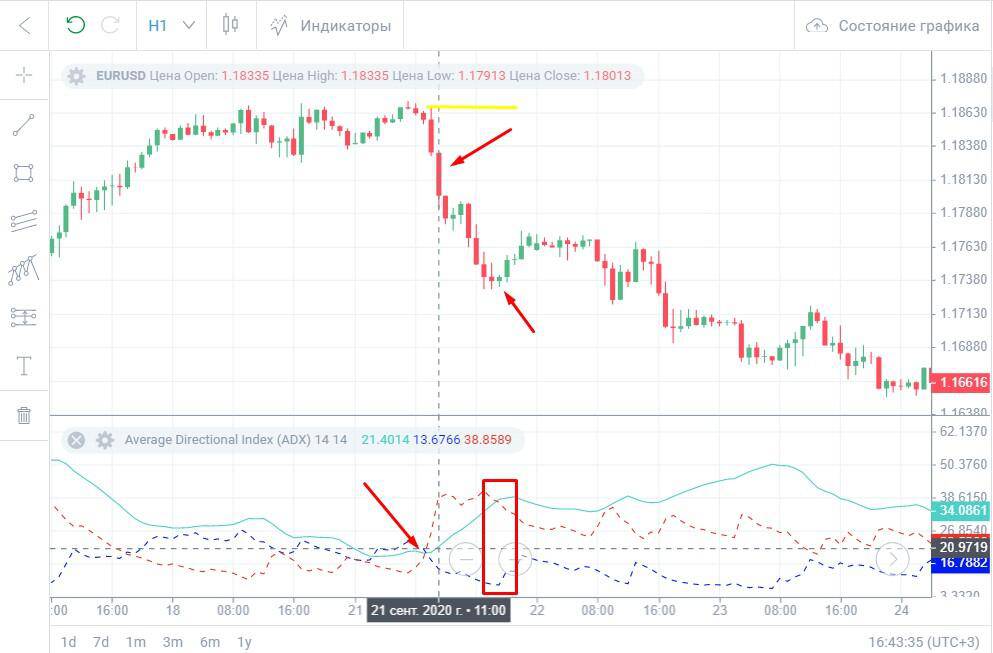
Let me remind you: the signal will be the simultaneous coincidence of 2 conditions:
- The dotted lines intersect and begin to diverge.
- The main line of the index at the time of the intersection is below the 20th level and after the intersection of the dotted lines begins an upward movement.
The point of intersection is indicated by an arrow. As soon as the ADX indicator rises above 20%, we open a short position, as -DI is at the top. The stop level is the maximum of the previous candle, the yellow line. It makes sense to set a trailing stop instead of a classic stop.
We begin to look for an exit from the transaction at the moment when the dotted lines have diverged to the maximum distance and begin to converge. On the area marked with a red rectangle, in addition to the reversal of the dotted lines, the index line also unfolds inside the range - trading is losing activity. This is confirmed by candlestick analysis - the bodies of red candles decrease with each subsequent candle. We close the deal with the appearance of the first green candle.
Profit was about 90 points on 4-digit quotes.
Using ADX to detect sideways movement
The main index line is great for identifying sideways movement. So that the dotted lines do not interfere, they can be turned off in the settings in the “Styles” tab.
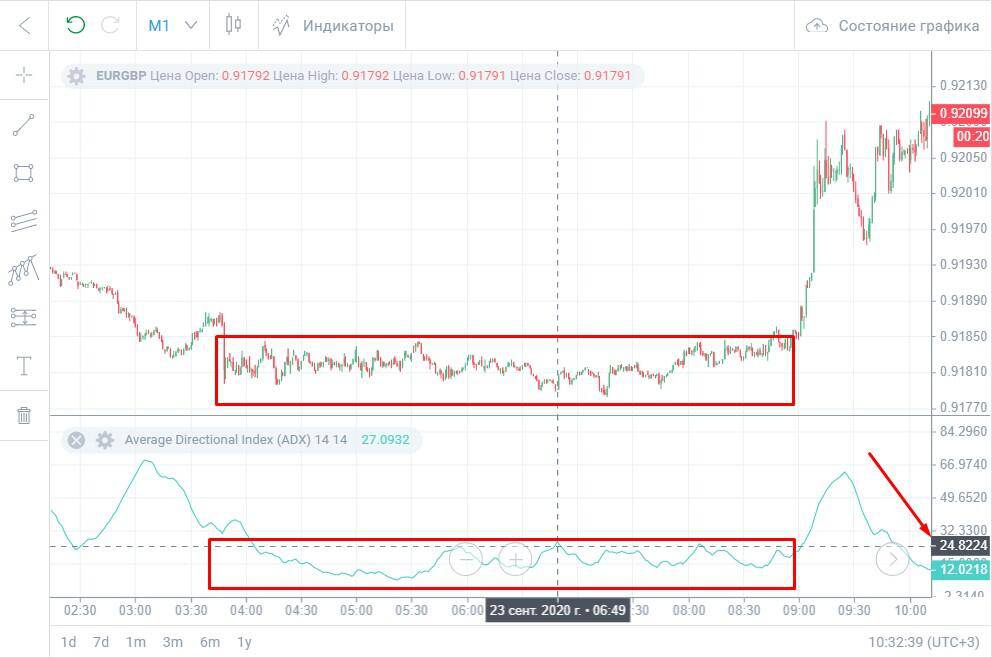
The indicator line on the minute interval for 5 hours was below the level of 25%. The price chart shows a clear narrow flat less than 10 points wide for 4-digit quotes. Given the spread on such a range, only scalping strategies are effective .
Looking for trends with ADX
A practical example of opening a deal. Right now, I will describe the principle of chart analysis and open a trade. And while it is in the market, I will continue the review. At the end I will tell about its results.
Flat trading may be of interest only to scalpers who open trades with a target profit of several points. The greatest earnings are obtained only with trend trading. The faster the price changes, the stronger the trend, the more and faster the transaction brings income.
ADX has two strengths:
- He does not get stuck in the sideways, warning about its onset and end.
- It shows the strength of the trend - the rate of price growth.
Its disadvantage is delay.
On the other hand, opening a trade on a long timeframe with the expectation of a long trend on a lagging signal is an ideal conservative strategy with minimal risk.
Now I will try to open a trade based on the information that is described in this review. I will find the beginning of the trend on the ADX indicator and enter the market.
1. Preliminary analysis.
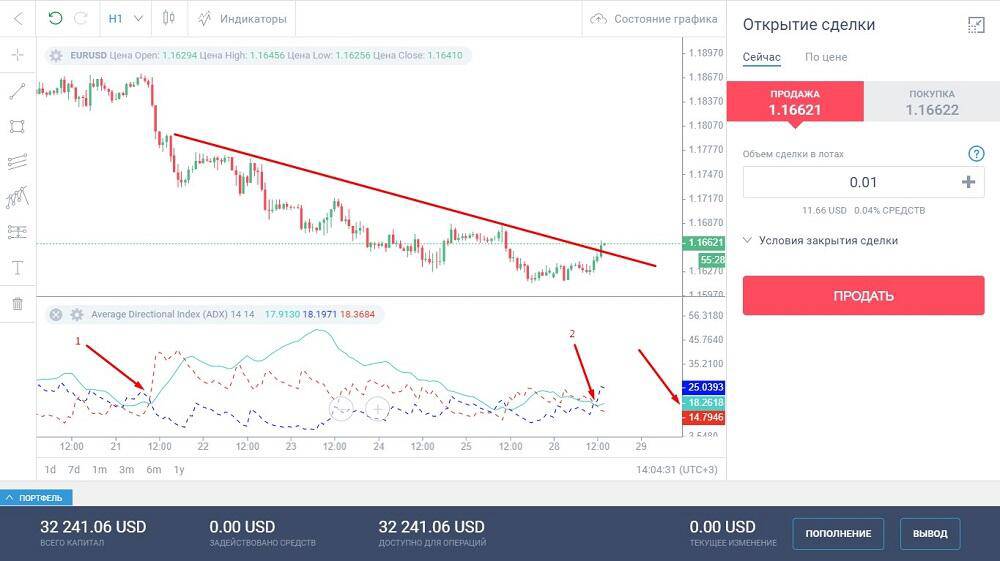
The situation indicated at point “1” was described at the beginning of this section. The index left the “0-20” zone after crossing the +DI and -DI lines, the red dotted -DI went up, indicating a downtrend.
After September 23, the trend began to fade - the main line began to decline, the dotted lines began to converge. This is a signal that the downtrend has exhausted itself. At 12:00 on September 25, all three lines converged at one point below the 20th level - a sign of a flat, after which a change in the direction of the trend is possible.
At point “2”, the dotted lines intersect, changing places - the first signal of the beginning of a growing movement. The second signal is a breakdown by green candles of the resistance level built on significant extremums of the downtrend. ADX is still below 20%.
2. Opening a deal.
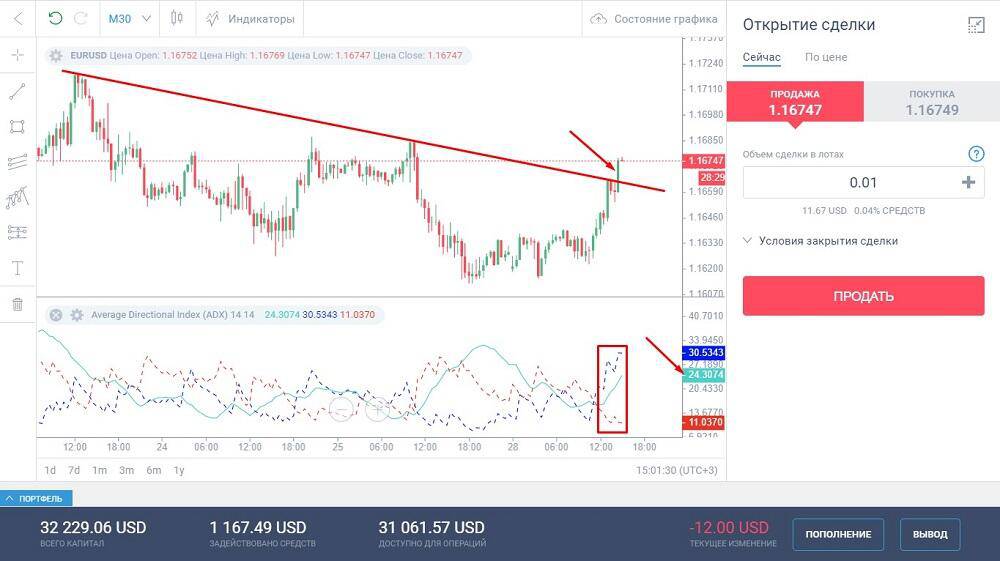
One of the working methods of technical analysis is to assess the market situation on a higher timeframe and open a deal on a lower one. The analysis was done on the H1 interval (previous screen). From it I saw:
- Breakdown of the resistance level.
- Row of growing candles.
- Divergence of +DI and -DI in favor of an uptrend.
- ADX reversal up in the lower zone.
I'm switching to M30. This is not desirable, but intuition and improvisation are important in trading. Here I see all the same conditions, but the ADX indicator has already crossed the 20% mark. With a delay of 1 candle, I still open a deal with a volume of 1 lot. Watching an open trade, I simultaneously monitor the situation on the hourly interval. After 30 minutes, the oscillator rose above 20% on the hourly interval. All signs of a trend change are present.
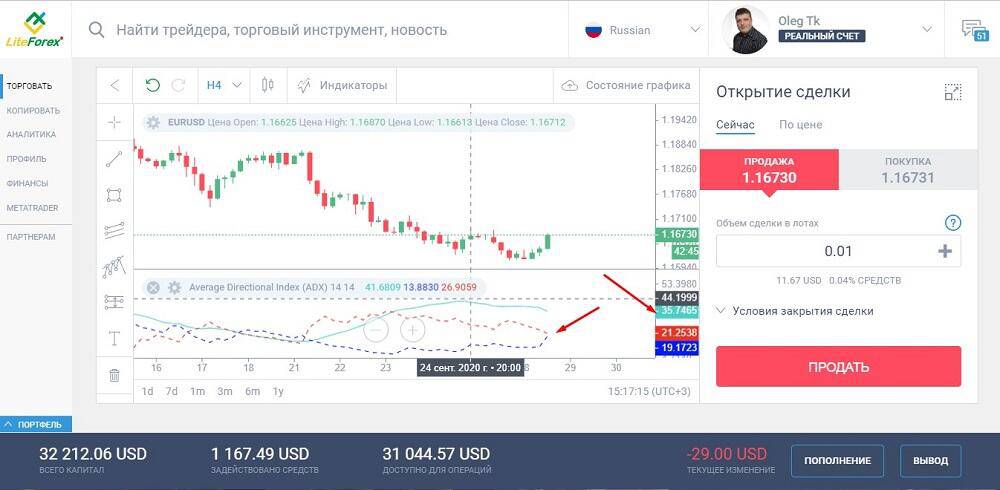
The H4 interval also shows an interesting picture. There is also a crossover of dotted lines with a signal of a trend change, but the ADX indicator has already bounced off the “40” level and is gradually going down. This may indicate that it is better to close a deal opened on a 30-minute interval within a day.
3. Closing the deal
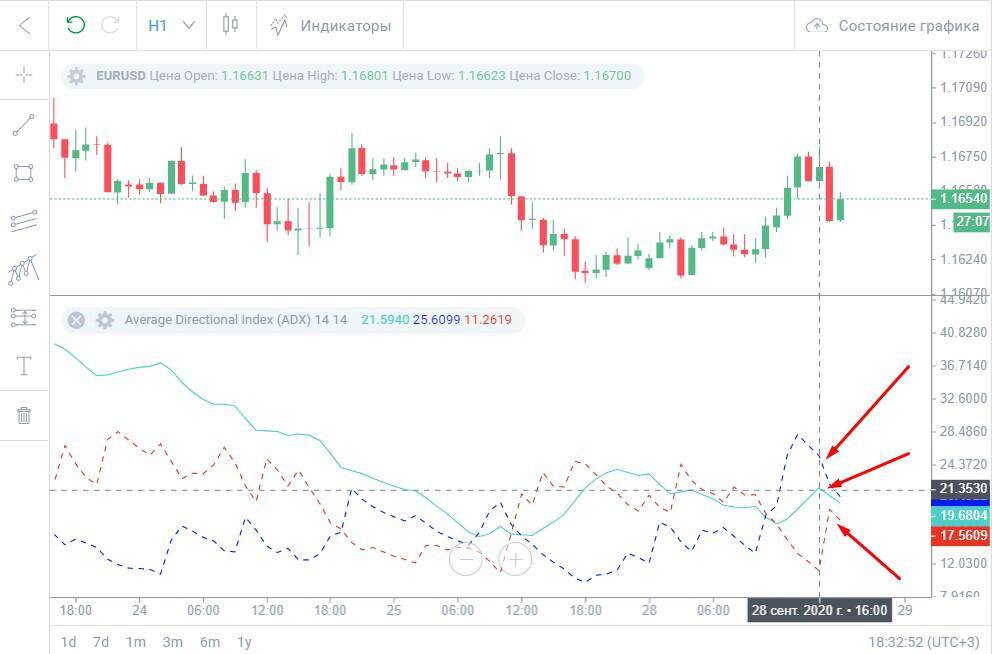
On the hourly interval, the indicator line turned down, the dotted lines began to converge. On this candle, the position could be closed. And if I did, my earnings would be just over $30. For a conservative strategy is normal.
But I decided to take the risk for the following reasons:
- Graphical analysis shows that the global downtrend is most likely over. Therefore, a large descending candle is only a temporary impulse.
- The oscillator on the H4 interval shows the continuation of the +DI and -DI divergence with the growth of the index line.
Whether my search for a new trend was really successful or whether the price will continue the downtrend, you will find out at the end of the review. And while ADX trading is in full swing, I will continue to consider the theory.
The best trading strategy with the ADX indicator
The index can be used in any strategy that involves opening deals on hourly timeframes and higher. Using it, you can perform a preliminary analysis for the presence of sideways movement in the market and receive signal confirmation in trend trading strategies. It works equally effectively on currency pairs, stock and commodity assets. Not suitable for pipsing strategies.
One of the most frequently asked questions is “What is the best intraday ADX strategy?”. Answer. Search for a flat section in the first third of the day, receiving a signal from patterns, trend indicators and opening a deal at the moment the price exits the flat. In this strategy, it is ADX that helps to distinguish the beginning of a strong trend from a false breakout.
How to build your own trading system with the ADX indicator:
1. Select the type of strategy. Scalping and swing trading are not suitable due to timeframe restrictions. Long-term - swap losses. A good option is intraday strategies.
2. Select tools. ADX is an auxiliary indicator. That's why:
- Make a choice of the main indicator of the strategy. You can get acquainted with the description of some of them in the Trading Indicators section. Below I will give a couple of examples of successful strategies with the Alligator and RSI, but you should not be limited to them.
- Add the construction of resistance and support levels to the strategy, look for formed patterns. Patterns and breakdown/rebound of levels are additional signals.
- Analyze the market on higher timeframes, open trades on lower ones.
3. Don't forget the fundamentals. They can drastically affect the price, while the indicators will show lagging data. At the time of the release of news on the economic calendar, it is better either not to open deals, or to increase stops on already open deals. Deposit and security if allowed. Or close deals.
The best ADX strategy is built entirely by you. First of all, it should be comfortable for you. Therefore, choose the optimal set of indicators by working out their combination on a demo account. The effectiveness of the strategy can be checked on the MT4 tester .
Advantages of ADX Indicator
- Easy to interpret ADX signals. The zone of location of the main line of the oscillator, the location of the +DI and -DI lines relative to each other are analyzed.
- Minimum settings. Period and smoothing.
- Versatility. Applies to any currency pairs. Shows both the strength and direction of the trend. It works well when the price exits the flat. Allows you to distinguish the beginning of a trend from a local correction.
—-
Disadvantages of ADX indicator
An entry signal given by the intersection of the -DI and +DI indicators is often false when the currency pair is in a trading range.
Conclusion
Remember, there are no strategies in Forex that do not make mistakes. A strategy based on the ADX indicator, like any other, requires confirmation of its signals. When building your own trading system, use multiple indicators.
Follow Money Management. Never risk more than 2% of your capital on a single trade. This approach will protect you from ruin and allow you to consistently earn on Forex with the help of the Average Direction Index.
Strictly follow your trading strategy. If, according to the strategy, the Average Directional Index (ADX) needs to open a deal, open it, if you fix the result, fix it, and it doesn’t matter if you are in the black or not. Only following the rules of the Average Directional Index (ADX) “from and to” will allow you to earn.