Accumulation / Distribution indicator - Tracking market sentiment
The distribution and accumulation strategy attempts to identify discrepancies in price and volume data and based on this, an advance warning of future price movements is generated. In this article, we will explain how the AD indicator works and how to use it as an assistant in making trading decisions. So let's start with the title.
What does "distribution and accumulation" mean?
These terms sound very “technological”, but in fact everything is much simpler.
What do you think investors do when they want to build a portfolio of stocks? They buy shares. By the same analogy, investors distributing shares on the market sells them. Similarly, an investor who allocates shares to the market sells.
The Accumulation and Distribution Indicator is, at its core, an attempt to assess the supply and demand that affect price movements. Let's see how the A/D accumulation/distribution indicator works.
Calculation of Accumulation and Distribution A/D indicator
The calculation of A/D starts with calculating the difference between the closing price and the daily low, from which the difference between the high and the closing price is subtracted. The resulting indicator is divided by the difference between the maximum and minimum, after which it is multiplied by the trading volume. At the final stage, the result is summed up with the value of A/D on the previous candle. Thus, each next value of the indicator shows the accumulated result of calculations of all previous periods.
Essentially, the volume is multiplied by a factor that ranges from 1 when the candle closes at its very high, to minus 1 when the opposite is true.
A/D indicator Description for MT4
You will find the MetaTrader 4 Accumulation Distribution Indicator in the Volumes folder in the Navigator.
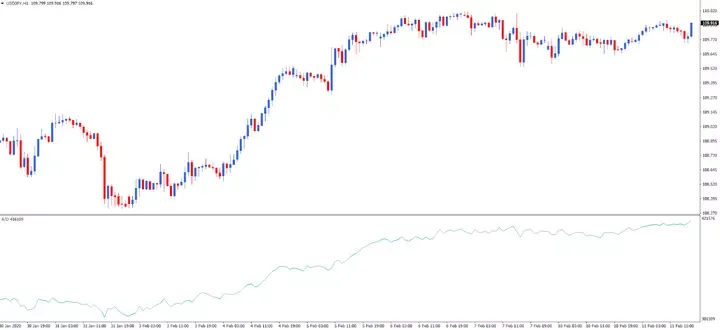
Adding an indicator to a chart is very simple as there are no numeric settings - just click OK and the Accumulation/Distribution indicator will appear below your main chart. The image below shows an A/D Forex chart added to an hourly USD/JPY chart:
How to use the Accumulation/Distribution indicator?
As we said earlier, the accumulation/distribution index - also known as the accumulation/distribution line - gives us an idea of the amount of supply and demand. The direction of the line tells us what kind of pressure prevails in the market - to buy or to sell. If we see the A/D line move up, the market is dominated by accumulation (buy trades).
If we see that the A/D line is heading down, this indicates that the market is dominated by sell (allocation) transactions. If the price and the A/D line move in the same direction, this gives weight to our confidence in the current trend.
But it's even more interesting when they move in different directions. As is the case with most indicators that measure the strength of price movement, the divergence between price and indicator readings is an important trading signal.
If the price goes down and the A/D indicator goes up, we can expect an upcoming price increase. That is, there will be a bullish reversal. Conversely, if the price is rising and the A/D indicator is falling, this suggests that prices may be about to fall.
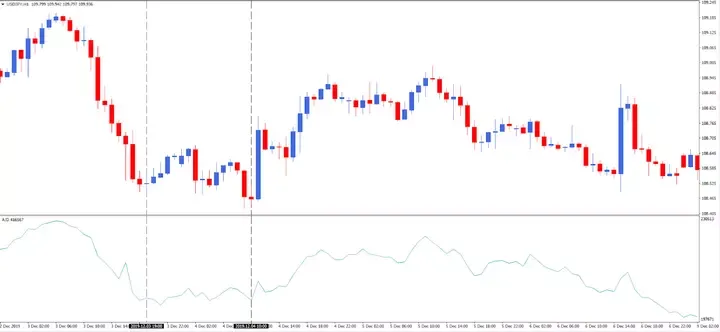
In other words, a bearish reversal is expected. Take a look at the daily USD/JPY chart below, in particular the area between the two vertical dotted lines:
You can see that during this short period of time the price usually goes down. The Accumulation Distribution indicator, however, shows a divergence - rising while the price is falling. This bullish divergence may let us know that we may see a price reversal soon. Which, in fact, is happening over the next few weeks, judging by the schedule (see above).
How to use the Accumulation/Distribution indicator with other trading instruments?
No indicator works flawlessly all the time, and very few indicators can be used without any additions. Therefore, it is almost always useful to use other tools and methods in combination with the distribution and accumulation indicator to increase its effectiveness.
For example, you can use the Pivot Points indicator to check where nearby support and resistance levels might be .
Accumulation/Distribution Forex Indicator - Conclusion
As we noted in our preamble, this indicator was originally developed for stock trading. Very specific volume data is now available for stocks. Instead, the Forex Distribution and Accumulation Indicator relies on tick volume to provide a volume ratio in its calculations.
In fact, this is a standard Forex method, which is also used for the Volumes indicator . Perhaps the biggest downside of the A/D indicator is that often the correlation between the indicator and price tends to stick around. This means that you need to be patient and wait for a divergence between the price and the A/D line, signaling a price reversal.
Discipline is an important skill in trading and this indicator definitely requires a balanced approach. We hope that this article has given you the answer to the question “what is a distribution and accumulation indicator?” If you enjoyed reading about this indicator, you might also find it helpful to read our article on the ADX indicator .


