Stochastic (Stochastic Oscillator)
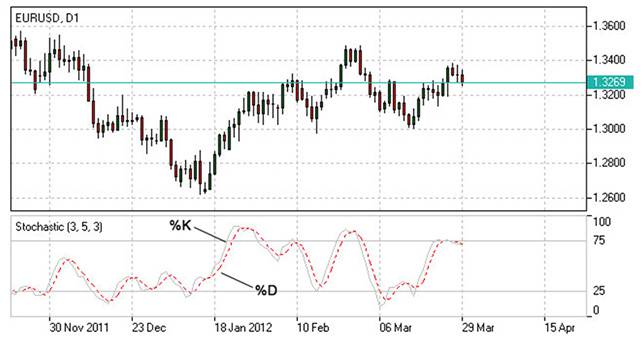
Stochastic or simply stochastic oscillator is a technical analysis indicator that shows the position of the current price relative to the price range for a certain period in the past. Stochastic is measured as a percentage; a value above 80% is a sell sign, below 20% is a buy sign.
Stochastics in plain language
Stochastics transforms the entire chart in a very specific way: the stochastic oscillator distorts the vertical price axis and turns it into percentages. Because the price can only fluctuate between 0 and 100%, stochastics allows you to see when the price is approaching its imaginary 100 percent, and when it is approaching its imaginary zero. In other words, the stochastic oscillator places the price in an absolute corridor , beyond which the price cannot physically go.
According to the interpretation of the author of the indicator, George Lane , the main idea is that when the price is rising ( uptrend ) , the closing price of the next timeframe tends to stop near the previous highs . With a downward trend in prices ( downtrend ) , the closing price of thenext timeframe tends to stop near previous lows .
In fact , the indicator demonstrates the divergence of the closing price of the current period relative to the prices of previous periods within a given time period.
Calculation of Stochastic Indicator
Four variables are used to calculate the stochastic oscillator:
%K periods. This is the number of unit periods used to calculate the stochastic oscillator.
Deceleration periods %K. This value determines the degree of internal smoothness of the %K line. A value of 1 gives a fast stochastic oscillator, while a value of 3 gives a slow one.
Periods %D. This is the number of unit periods used to calculate the moving average of the %K line.
Method %D. This is the smoothing method (exponential, simple, smoothed, or weighted) used in calculating %D. =====
Formula for calculating %K:
%K = (CLOSE - MIN (LOW (%K))) / (MAX (HIGH (%K)) - MIN (LOW (%K))) * 100
Where:
CLOSE - today's closing price;
MIN (LOW (%K)) - the smallest minimum for the number of periods %K;
MAX (HIGH (%K)) - the highest maximum in the number of periods %K.
The moving average %D is calculated using the formula:
%D = SMA(%K, N)
Where:
N is the smoothing period;
SMA is a simple moving average .
How to interpret Stochastic Signals
There are three most common ways to interpret the Stochastic Oscillator:
- Buy when the oscillator (%K or %D) first falls below a certain level (usually 20) and then rises above it. Sell when the oscillator first rises above a certain level (usually 80) and then falls below it.
- Buy if the %K line rises above the %D line. Sell ??if the %K line falls below the %D line.
- Watch for discrepancies. For example: prices make a series of new highs and the Stochastic Oscillator fails to rise above its previous highs.

How to use Stochastic
The main signal of the oscillator is the exit of lines from p / p zones. If the price is in consolidation, then everything is simple: buy transactions are carried out when the indicator starts to cross the level 20 from the bottom up, and the sell signal is the top-down crossing of the 80 level. Stochastic can also be used in trends. For example, the asset chart shows growth with periodic rollbacks, and at this time the lines on the oscillator go beyond level 20 - this is a great opportunity to enter a buy trade in the direction of the trend. For a falling price, the situation is mirror-like.

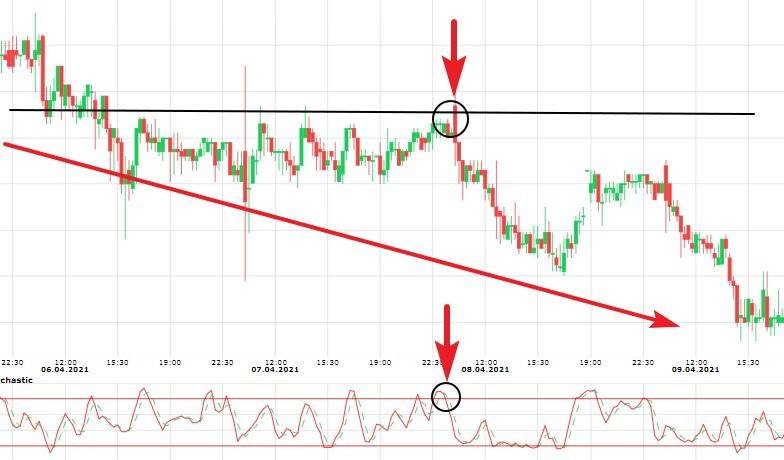
The figure above shows the real situation on the chart (Aeroflot shares). In the downtrend, a price congestion has formed, and the Stochastic has shown that the price is in the overbought zone. An additional signal was the fact that the quote hit the resistance level. An excellent solution in this case would be to wait until the indicator lines start to leave the overbought zone and make a sell trade.
It is important to remember one rule here: do not enter the market against the trend, even if the Stochastic indicator gives an excellent signal for this.
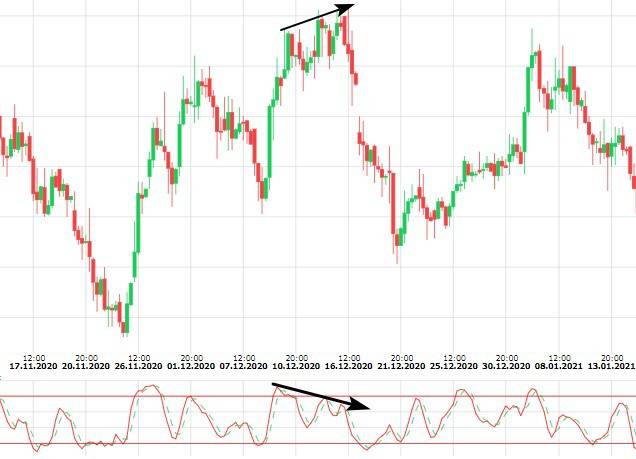
An equally favorite way for traders to use the Stochastic is to detect divergence. This is a strong trend reversal signal given by some indicators. A situation is called divergence when the price of an asset updates a new extreme point, moving in the same direction, and at the same time a reversal occurs on the indicator. Let's see how it looks on the chart.

As you can see from the chart, despite the growth of the stock, the Stochastic has shown that it is not going to follow the trend. There was a discrepancy between the quotes of the asset and the indicator readings. After a while, the graph went down. Here, the signal for a trade was the intersection of the indicator lines when moving down at the second top.
Disadvantages of Stochastic indicator
- Claims to Stochastic are traditional for all oscillators. They work reliably only in wide flat ranges or stable trends with a clear direction . Scalpers who traditionally try to use its various versions, as a rule, are in for disappointment and quick losses - on short periods, their signals are hopelessly late.
- Speculative markets cause a lot of incorrect signals on the Stochastic (“spikes” to max/min), and too strong trends lead to the indicator sticking in critical zones for a long time, not performing its functions and missing good entry points.
- A more or less stable result can be obtained using a combination of two Stochastics with parameters for different periods, for example, Stochastic (5,3,3; 30/70) + Stochastic (21,9,9; 20/80). In such a scheme, the indicators mutually compensate for the shortcomings: false signals on short timeframes and delays on long timeframes.
- It is impossible to estimate the strength of the price impulse by the intersection points of the Stochastic lines. The exit of the indicator lines into the overbought / oversold zones does not at all mean a signal for the immediate opening of a transaction - all such situations must be confirmed by trend indicators .
Conclusion
Stable systems exclusively based on Stochastic signals are almost never found, usually it works only as a basic oscillator. Indicator parameters should take into account the style, period and conditions of money management of a particular trading strategy : intraday systems should not miss the moment of reversal, which is achieved by short-term settings, long-term parameters help in positional trading and filter out false signals. And the fact that before using the Stochastic indicator, everyone will have to adapt it to their own goals, does not reduce the value of the classic indicator for modern trading.
Remember, there are no indicators in Forex that are not wrong. Stochastic Oscillator, like any other, requires confirmation of its signals. When building your own trading system, use multiple indicators.
Follow Money Management. Never risk more than 2% of your capital on a single trade. This approach will protect you from ruin and allow you to consistently earn on Forex with the help of the Stochastic Oscillator (Stochastic Oscillator).
Strictly follow your trading strategy. If, according to the Stochastic Oscillator strategy, you need to open a deal, open it; if you fix the result, fix it, and it doesn’t matter if you are in the black or not. Only following the rules of the Stochastic Oscillator (Stochastic Oscillator) “from and to” will allow you to earn.