4 indicators to currently use in the stock market
While the markets are strongly heckled in a context of war and economic uncertainty after many months of rise in a Covid-19 crisis which has been favorable to stock exchanges around the world, it is legitimate to ask the question of knowing where are the stock prices? Are we on a market peak or trough? The basis of trading being to seek to buy low and sell high, this is the question that all traders are currently asking.
We will see in this article which are the four technical indicators to use to try to detect the price zones which could experience an upcoming reversal.
Overbought and oversold zone
To analyze the markets and know where we are compared to past prices, traders will use technical indicators that will identify overbought and oversold areas.
Overbought areas and oversold areas are price areas that are abnormally high or low relative to price patterns seen in the recent past. We can say that it is an exaggerated rise or fall, caused by an unusual influx of buyers or sellers. These are price zones considered to be extreme during which traders anticipate a trend reversal.
It is of course important to successfully identify these price zones so that you do not buy when the market is overbought, nor sell when the market is oversold. On reading this may seem relatively easy, yet it is difficult for many newbie traders to measure. Succeeding in mastering this aspect is the keystone of a winning trading strategy.
Relative Strength Index (RSI)
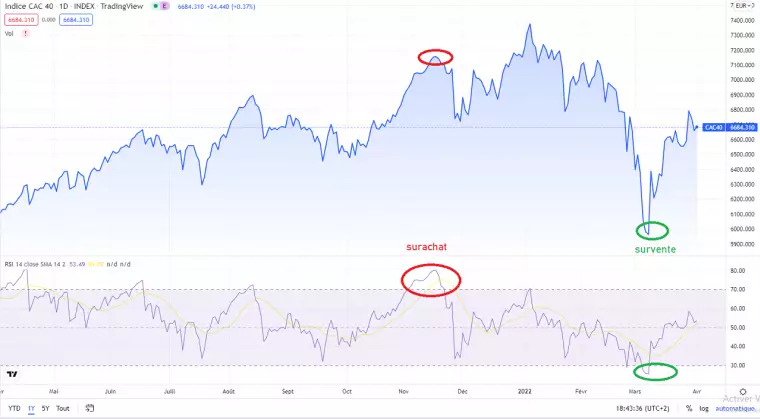
The RSI is one of the best-known technical indicators for analyzing and detecting overbought and oversold areas. The indicator is represented in the form of a curve independent of (often below) stock market prices.
When the value of the RSI is between 30 and 70, it is considered that there is no price exaggeration. However, when the RSI indicator goes beyond these levels, the market is considered oversold if it is below the 30 level and overbought if it is above 70.
The longer the time horizon studied with this indicator, the more reliable the information provided by the indicator.
Below is an example of overbought and oversold areas that are clearly highlighted thanks to the RSI on the CAC 40.
Examples of overbought and oversold areas of the CAC 40 identified using the RSI

Stochastic Oscillator
Very close to the RSI in its mode of operation, the stochastic is a bounded indicator whose value will necessarily be between 0 and 100.
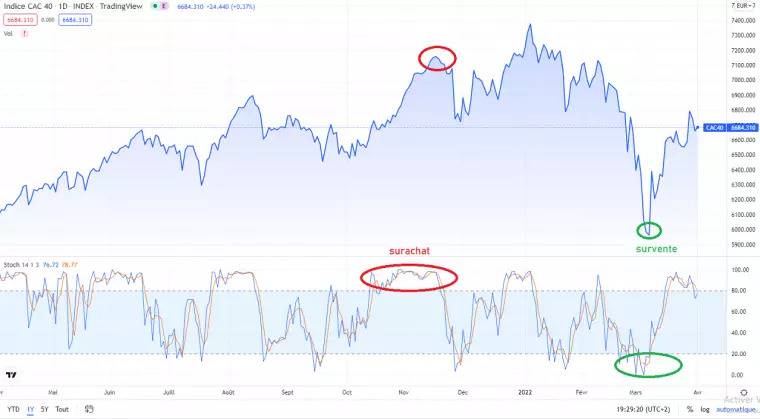
The market is considered oversold when the indicator displays a value between 0 and 20; Conversely, it is estimated that the market is overbought when the indicator displays a value between 80 and 100.
This indicator also offers a second reading. Thus, the crossings of the two curves that compose it are interpreted by traders as confirmation of a possible imminent market reversal if the value, of course, is overbought or oversold.
Another important point that will differ with the Stochastic is that it will tend to stay in the overbought and oversold areas for longer. It is therefore more difficult to read since you will have to wait for confirmation and not rush into a purchase or a sale.
Here is an example of its use on the CAC 40, over the same period that we analyzed with the RSI.
Examples of overbought and oversold areas of the CAC 40 identified using the stochastic oscillator

As explained previously, it is clearly seen that the signals are much less precise than with the RSI. On the other hand, this indicator gives more signals and therefore more opportunities.
Bollinger Bands
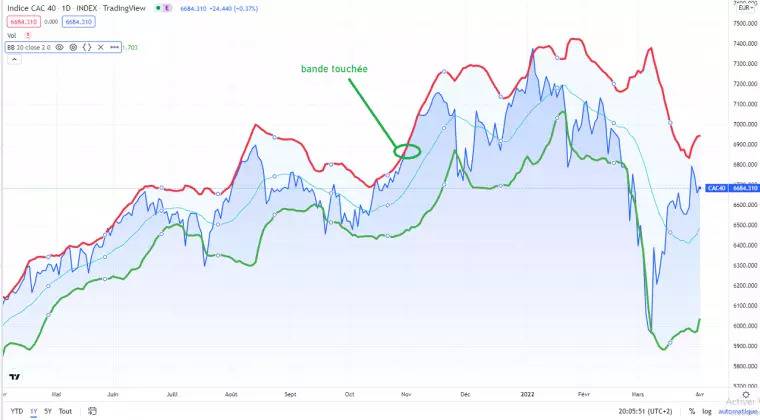
Bollinger bands are usually an indicator that is rather used to measure market volatility by analyzing the gaps between the two curves. However, many traders use the high and low bands of this indicator to anticipate the levels at which the market could be likely to turn around since being abnormally high or low.
If the indicators we have seen so far are represented outside of stock market prices, the Bollinger bands are represented in the price curves, and even more since they encompass the market price curves.
This indicator tends to give bad signals more often, or more precisely good signals that come too early. It is therefore relevant to use this indicator as a pre-signal, that is to say that we will not use the signal delivered by the Bollinger bands to enter a position upwards or downwards, but as a warning to the trader to start carefully following another indicator such as the RSI.
Thus, it will allow us to be alert and avoid missing an opportunity.
In the example below, we see that when the band is hit, the RSI signal comes right after it. On the other hand, entering a “Short” position when the price touches the upper band would have given a very bad entry point on the CAC 40.
Examples of overbought and oversold areas of the CAC 40 identified using Bollinger bands

Commodity Channel Index (CCI)
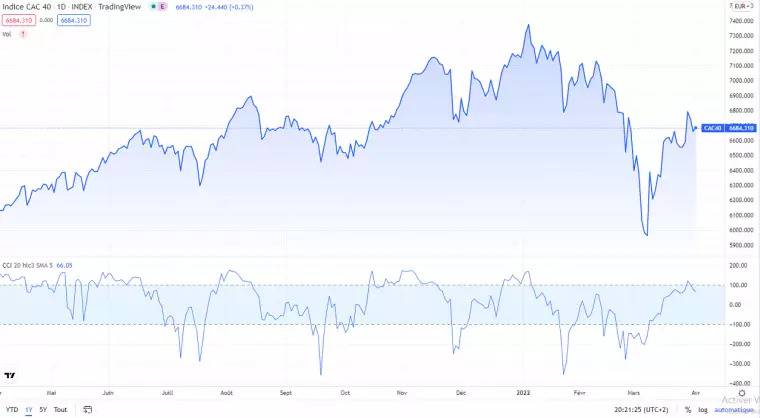
As the name suggests, it was initially used in commodity markets. The CCI is an indicator halfway between the RSI and the Stochastic. Quite close to the RSI in the nature of the signals given and unbounded, it gives signals when the value leaves the channel between -100 and +100 (see image below).
This indicator helps identify overbought and oversold markets by comparing the current price movements of the instrument to historical fluctuations.
Some traders will prefer to use the -150 and +150 zones to reduce false signals.
Examples of overbought and oversold areas of the CAC 40 identified using the Commodity Channel Index

4 indicators to master before using them for trading
Either way, these four indicators will allow traders to spot abnormal highs or lows where the market is most likely to change direction.
Whether it is one or the other, the trader will have to choose the indicator(s) with which he is most comfortable. It will also of course require training to master the use of these indicators before being able to handle them with ease.
We remind you that technical analysis is not an exact science and that it is also necessary to master risk management, fundamental analysis and macro-economics to have all the cards in hand to make good trading decisions. investment.